eResearch | Energy sector and its associated companies and their stocks seem likely to continue to outperform despite increasing economic and market headwinds.
In September and October 2021, we wrote about Suncor Energy Inc. (TSX:SU | NYSE:SU), here are links to the previous reports:
Suncor Current Market Data
- Last Price (Jan 28th): C$36.15
- 52-Week High/Low: C$36.69 – C$21.065
- 2022 High/Low: C$36.69 – C$32.00
- Quarterly Dividend: C$0.42
- Annual Dividend/Yield: C$1.68/4.65%
- Dividend Pay Month: May, June, September, and December
- Shares O/S: 1.457 billion
- Market Cap: C$52.67 billion
- Trading Volume:
- Average 50-Day: 11.31 million shares
- Average 200-Day: 9.06 million shares
Update
The first two charts show WTI oil prices for (a) five years, and (b) one year.
Chart 1: WTI Crude Oil Prices: Five Years
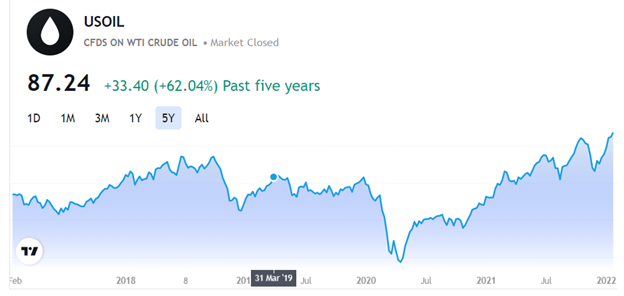
Chart 2: WTI Crude Oil Prices: One Year
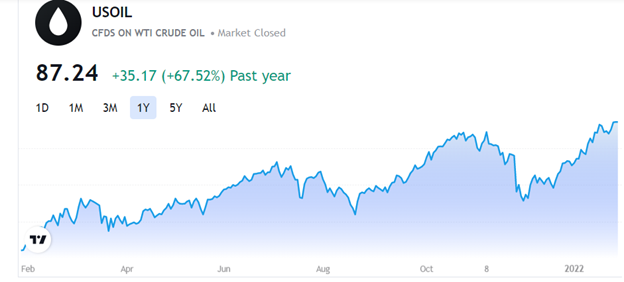
Observations: The five-year chart clearly shows the recovery in WTI crude oil prices that occurred in 2021. Prices benefited from the global recovery from the pandemic lows reached in 2020.
As 2021 progressed, Energy became all the rage since it began its price ascendency about mid-August 2021.
This is clearly reflected in the performance of the Canadian Energy ETF, XEG, shown in Chart 3 below. It briefly double-topped in November, but started to rise again in mid-December. Despite the short pull-back in mid-January, the ETF has gone back up as January comes to a close. The Energy Sector has far outpaced all other market Sectors as well as the major Indexes. For the month of January, XEG is up a remarkable 16.8%.
Here is the chart for the Canadian Energy ETF: XEG for the past six months.
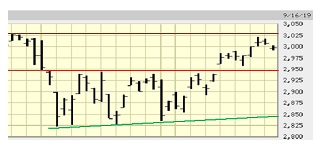
Chart 3: Canadian Energy ETF: Six-Month Chart
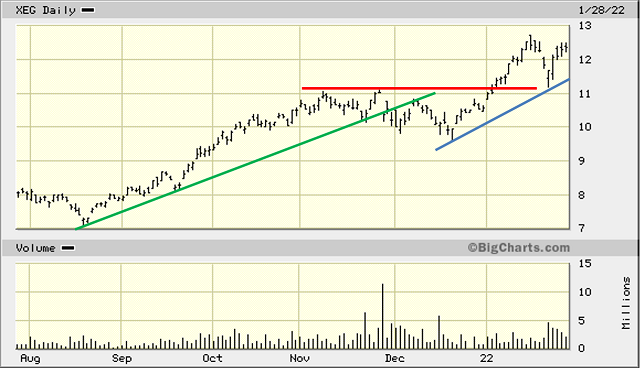
Observations: The GREEN uptrend line that began in mid-August came to an end at the beginning of December after the ETF experienced a double-top in mid-November (RED Resistance line). The rally continued in mid-December (BLUE uptrend line). With the global economic recovery spurring demand, the oil demand/supply equation continues to be out-of-whack, and this could remain this way for some time. If so, that uptrend line could and should continue much higher.
The current geopolitical problems now facing Ukraine and the United Arab Emirates, plus the inability of some of the OPEC+ members to raise their quotas, are keeping supply tight. Until there is a slackening in demand, there is nowhere for oil prices to go but up. Many pundits are expecting WTI to reach US$100/bbl. WTI closed on January 28 at US$87.24/bbl and Brent was at US$90.03/bbl.
Now, what about Suncor?
The share price for Suncor (TSX: SU; and NYSE: SU) closed on Friday, January 28 at C$36.15, compared to C$24.27 in our September 20 report (closing price from Friday, September 17), and C$28.81 in our October 11 report (closing price on Friday, October 8).
Here is Suncor’s chart over that period.
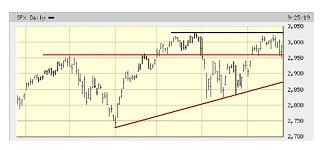
Chart 4: Suncor Energy: Six-Month Chart
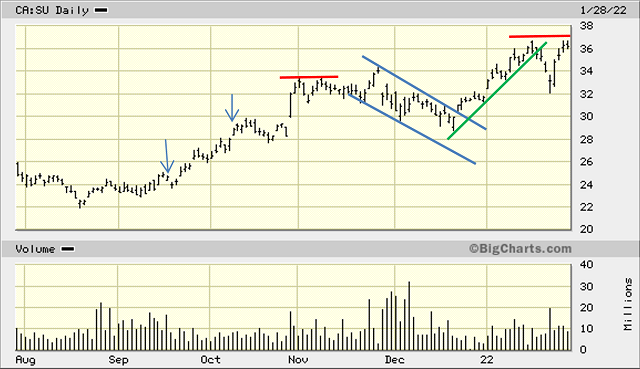
Observations: The two arrows show the prices at the time of our previous reports. The first RED horizontal Resistance line capped the upward move that started in mid-August. The stock then formed a declining BLUE rectangle, which is considered a bullish formation if it occurs within a rising trend, as we have with Suncor.
The next up-leg, denoted by the GREEN uptrend line was short-lived. The stock then formed a subsequent “V” formation rising back to its intra-day high of C$36.69, which is very slightly above the previous high of C$36.65 on January 18 (Friday, January 28 closing price = C$36.15). We show another horizontal RED Resistance line that includes the current price although, truly, it is premature to draw such a resistance line because the formation has not been confirmed.
Nevertheless, the stock has to continue to rise above this possible Resistance line in order for the rally to be sustained. If it fails to do so in the next few trading days, the implications are that the stock could retreat to the first Support level of C$32.00 and, if that does not hold, then it could go down to test the bottom of the rectangle just under C$29.00.
Price Targets
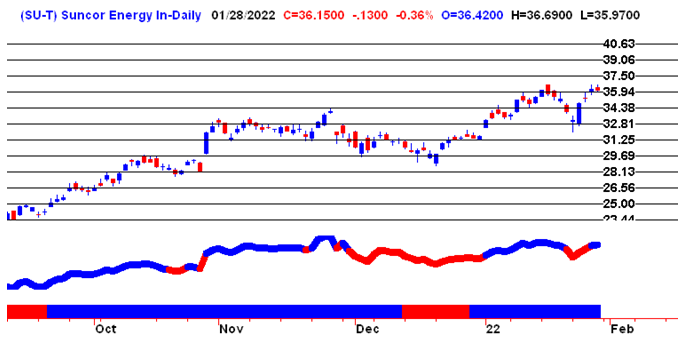
The next chart, courtesy of www.theuptrend.com, shows possible price targets for SU. These are (1) C$37.50 (+3.7%); (2) C$39.06 (+8.0%); and (3) C$40.63 (+12.4%).
Chart 5: Suncor Energy Price Targets: Four-Month Chart
Notes: All numbers in CAD unless otherwise stated. The author of this report, and employees, consultants, and family of eResearch may own stock positions in companies mentioned in this article and may have been paid by a company mentioned in the article or research report. eResearch offers no representations or warranties that any of the information contained in this article is accurate or complete. Articles on eresearch.com are provided for general informational purposes only and do not constitute financial, investment, tax, legal, or accounting advice nor does it constitute an offer or solicitation to buy or sell any securities referred to. Individual circumstances and current events are critical to sound investment planning; anyone wishing to act on this information should consult with a financial advisor. The article may contain “forward-looking statements” within the meaning of applicable securities legislation. Forward-looking statements are based on the opinions and assumptions of the Company’s management as of the date made. They are inherently susceptible to uncertainty and other factors that could cause actual events/results to differ materially from these forward-looking statements. Additional risks and uncertainties, including those that the Company does not know about now or that it currently deems immaterial, may also adversely affect the Company’s business or any investment therein. Any projections given are principally intended for use as objectives and are not intended, and should not be taken, as assurances that the projected results will be obtained by the Company. The assumptions used may not prove to be accurate and a potential decline in the Company’s financial condition or results of operations may negatively impact the value of its securities. Please read eResearch’s full disclaimer.