Chart-of-the-Day
Chart of the Day – Suncor Energy Inc.
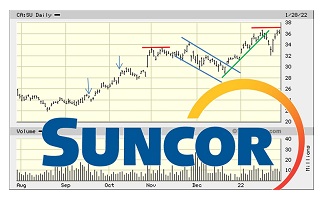
The Energy sector and its associated companies and their stocks seem likely to continue to outperform despite increasing economic and market headwinds. [more]
The Energy sector and its associated companies and their stocks seem likely to continue to outperform despite increasing economic and market headwinds. [more]
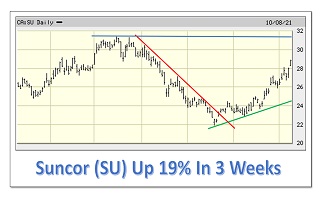
This is an update article to the original “Chart of the Day” report on Suncor from September 20, 2021. Suncor’s stock price is up 19% in 3 weeks. [more]
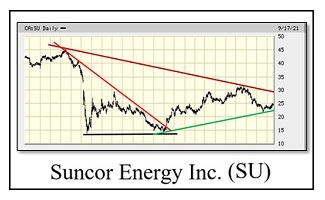
The Energy sector has not performed well over the past ten years. One of the laggards in the last few years is Suncor. This can be attributed to its almost singular focus on its oil sands projects. But, Suncor is now seriously evaluating non-fossil fuels opportunities. If Suncor can break above the Chart’s declining down trend-line, this would be very favourable for the stock, with greater expectations for further appreciation. [more]

The Energy Sector fared a little better over the last two weeks. However, our Model Oil Portfolio dropped 0.9% and is now down 5.7% since inception on June 2, 2019 while, for 2020, it is off 14.6%. Many of the benchmarks we use are also struggling. The fear is that the coronavirus could spread globally and instigate a significant slow-down in a variety of economic areas. [more]

The specter of a coronavirus epidemic gripped the markets in the last few days with a broad sell-off occurring across almost all indexes. We are on the cusp of this health threat, and we could know soon whether it will proliferate or be contained. [more]

It was somewhat of a wild ride last week as, at first, oil stocks surged with increasing global political tensions, but then they retrenched as these tensions dissipated. [more]

We close out the year on a high note. Our Model Oil Portfolio stands at an all-time high. We hope to continue this positive performance in 2020. [more]
October was not a kind month to the Energy sector, perhaps highlighted by the surprising, if not shocking, abandonment of Canada by Encana Corp. [more]
Copyright © 2026 | MH Magazine WordPress Theme by MH Themes