eResearch | The last time we published our Model Oil Portfolio was in the middle of September when the Portfolio had just got into the “Black”, where it stayed until October 1. October was not a kind month to the Energy sector, perhaps highlighted by the surprising, if not shocking, abandonment of Canada by Encana Corp. Our Portfolio declined by $13,000, or 4.4%. November is a different story. The Portfolio has risen $25,000 since November 1, a gain of 9.1%.
Portfolio Changes
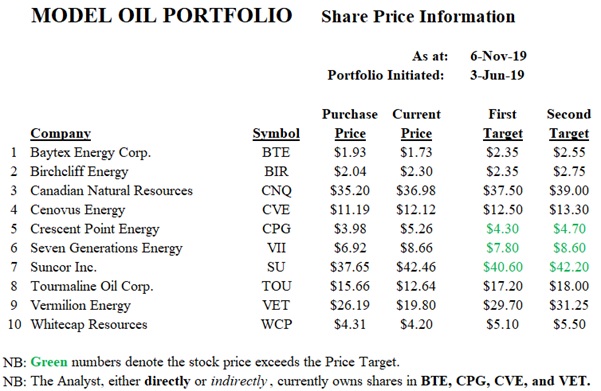
We decided to unload Encana after its disappointing announcement, taking a hit of 20%. We replaced it with Birchcliff Energy, which is up 12.7% since its acquisition on November 1.
Winners and Losers
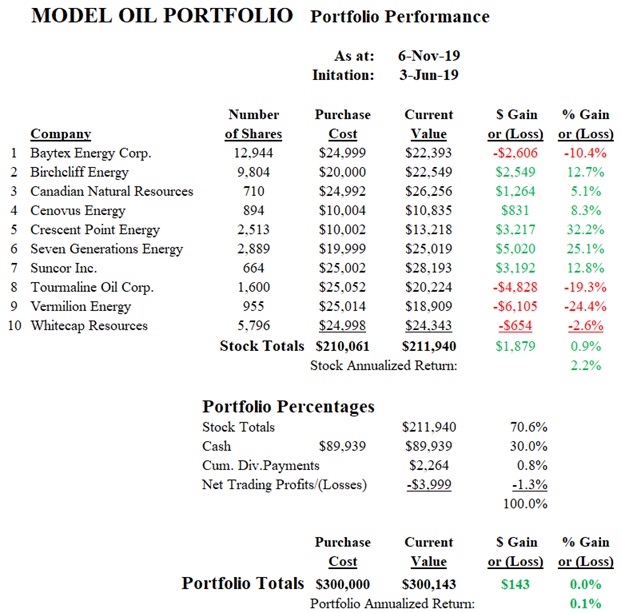
There are currently 4 of the 10 stocks in the Portfolio that are “under water”. Overall, the stock portion of the Portfolio is up only 0.9%. However, taking into account the cash component, accumulated dividends, and stock trading losses, the Total Portfolio is absolutely flat since inception on June 3 at 0.0%.
The best-performing stocks are Crescent Point Energy (up 32.2%) and Seven Generations Energy (up 25.1%). The two worst-performing stocks are Vermilion Energy (down 24.4%) and Tourmaline Energy (off 19.3%).
Cash Position
We continue to hold a sizable cash position, currently 30% of the Total Portfolio. There were instances where we could have added to existing positions but we were reticent in this still negative-sentiment environment towards the Energy sector and the fossil fuels group in particular.
Outlook
Someday, we believe that Canada’s Energy sector is going to show robust recovery growth. The problem is that current or new investment in this space may be dormant money for quite a while. Of course, timing is everything. But it looks like the industry is wrung out as much as it is going to be for at least the foreseeable future. This means that there is likely to be very rich rewards for the patient investor.
PORTFOLIO PERFORMANCE
The following table shows how the Portfolio has performed since inception on June 3, 2019.
INDUSTRY COMPARISON
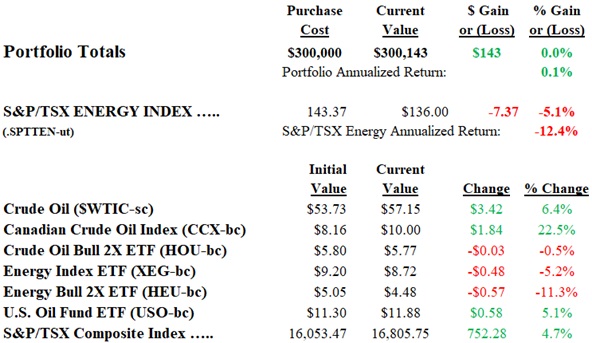
Next, the return on the portfolio is compared to various energy bench-marks.
The Portfolio since inception is currently flat. The S&P/TSX Energy Index is off 5.1%. The Energy Index Bull 2X ETF (HEU) is down 11.3% and the Energy Index ETF (XEG) is down 5.2%. The price of crude oil is up 6.4% and the Canadian Crude Oil Index (CCX) is upa significant 22.5%.
DIVIDENDS and YIELDS
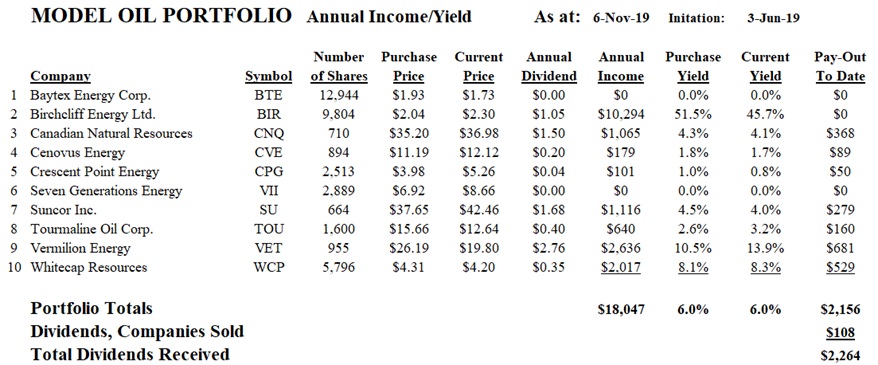
The table below indicates the annual dividend and corresponding annual income and yields. This table is updated twice monthly or when a stock is bought or sold.
Source: eResearch Corp.