eResearch | Down! Down! Down! It was another traumatic week for the Energy Sector. Our Oil Portfolio dropped 4.0% and is now down 4.8% since inception on June 2, 2019 while, for 2020, it is off 12.6%. The benchmarks we use are also off significantly. The fear is that the coronavirus could spread globally and instigate a significant slow-down in a variety of economic areas.
Portfolio 2020 Performance
At the beginning of 2020 the Model Oil Portfolio stood at $326,659. It has dropped over $40,000 since then and is off 12.6% since the year began. Last week’s close was $285,513.
Portfolio Comparison
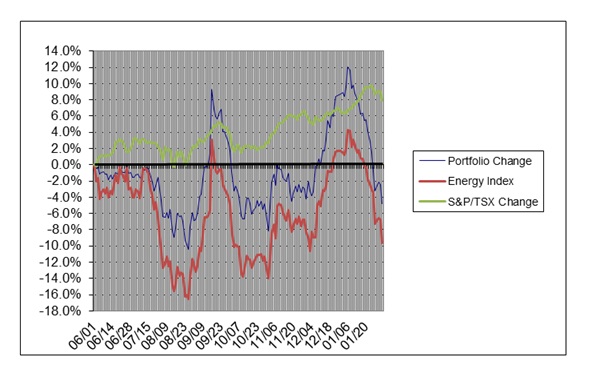
For comparison, the S&P/TSX Energy Index is down 11.2% and the price of crude oil is off 15.6%. You can check our overall performance in the tables and graphs set out in our comprehensive report that has a link to it at the end of this article.
Winners and Losers
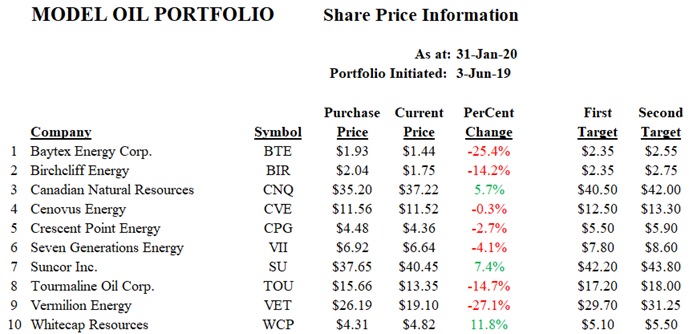
Of the 10 stocks in the Portfolio, there are only 3 that are showing a profit so that 7 are “under water”. This is exactly opposite of the case two weeks ago. Also, a fortnight ago, many of the stocks were above their respective Target Prices. Now, none are. It is just as well that we did not revise any of the Target Prices upward.
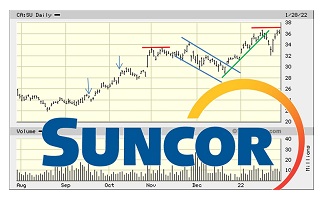
Our 3 positive-performing stocks since inception are Whitecap Resources (up 11.8%), Suncor Inc. (up 7.4%), and Canadian Natural Resources (up 5.7%).
Our 3 laggards are the same as two weeks ago: Vermilion Energy (down 27.1%), Baytex Energy (down 25.4%), and Tourmaline Energy (down 14.7%).
Cash Position
Unfortunately, we used some of our sizable Cash holding to add to two positions: Cenovus Energy and Crescent Point Energy. Bad timing! However, the Cash component, at 19%, still continues to be a sizable proportion of the Portfolio.
GRAPHIC COMPARISONS
As at January 31:
Portfolio = -4.8% after dividends and trading losses; -6.2% (stocks only)
S&P/TSX Energy Index = -16.2%
S&P/TSX Composite = +7.9%
As at January 31, 2020: