Chart-of-the-Day

Chart of the Day – Update on Canadian Utilities Limited

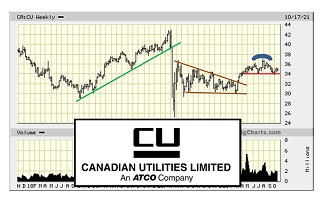
Since April 2020, CU has been trading in an extensive rectangle between $30 and $37. One year later, in April 2021, the stock began its assault on its upper parameter, but the stock failed to overcome resistance at $37. It seems that some kind of catalyst is needed to get CU “over the hump”. [more]

Technical Pundits

Weekly Technical Video

eResearch is pleased to provide the weekly technical market video from theUpTrend.com. The weekly technical video takes a longer-term view of the market. Charts are explained for world market indexes, several market sectors, key commodities, and global currencies. [more]

McClellan Chart-In-Focus

Inverted Yield Curve, Small-Caps, & Gold

eResearch is pleased to provide the latest McClellan Chart-In-Focus report from McClellan Financial Publications. Today’s article looks at the relationships between small-cap stocks, the price of gold, and the current inverted 10-year/3-month yield curve. [more]

Technical Pundits

Weekly Technical Video

eResearch is pleased to provide the weekly technical market video from theUpTrend.com. Charts are explained for world market indexes, several market sectors, key commodities, and global currencies. [more]