eResearch | Utility stocks are generally perceived as defensive stocks, exhibiting attractive dividend yields with a modicum of upside potential in the stock price. In October 2021, we wrote about Canadian Utilities Limited (TSX: CU), a diversified global energy infrastructure company. Here is a link to our Original Report.
Canadian Utilities recent market data:
- Current Price (January 13 close) = $35.66
- 52-Week High-Low = $37.00 – $29.96
- Annual Dividend = $1.76
- Current Yield = 4.9%
UPDATE
At the time of our October 24, 2021 report, the shares of Canadian Utilities were trading at $34.94 (closing price from Friday, October 22).
Since then, the shares have continued their range-bound status (see Chart 1 below) and moved between $37.00 and $34.12.
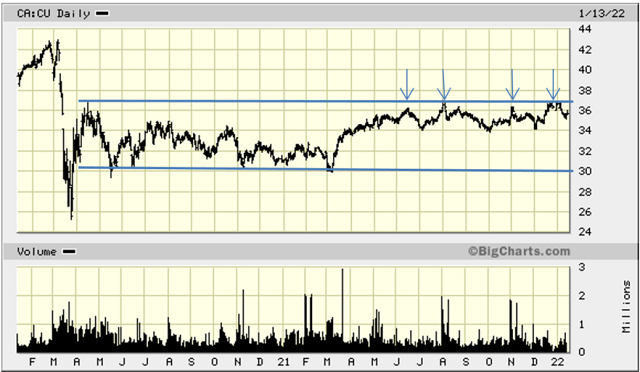
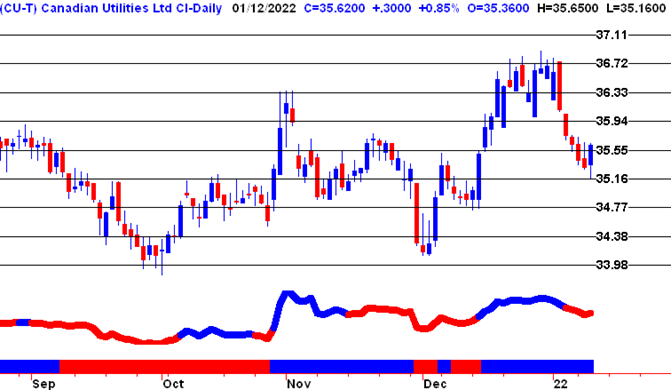
Chart 1: Three-Month Stock Chart
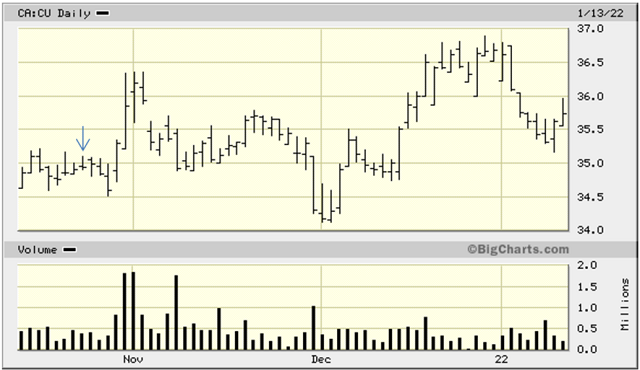
Observation: October 22 is denoted by the blue arrow. As shown, CU traded between $34 and $37. The range-bound pattern, which is a rectangle technical formation, is depicted in Chart 2 below.
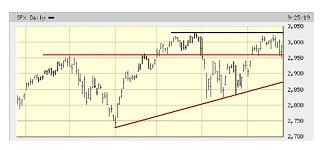
Chart 2: Two-Year Stock Chart #1
Observation: Since April 2020, CU has been trading in an extensive rectangle between $30 and $37. One year later, in April 2021, the stock began its assault on its upper parameter. Four times (shown by the blue arrows), the stock failed to overcome Resistance at the $37 mark! It seems that some kind of catalyst is needed to get CU “over the hump”. Unfortunately, a utility stock tends not to do well in a rising interest rate environment. We are on the threshold of a rising interest rate environment! This does not augur well longer term. Countering that, from a seasonality standpoint, Utilities exhibit their period of strength during March and April.
Comment: In our October 2021 report, we used a four-year chart to analyze a technical pattern from a different standpoint. That chart is reproduced below, together with our Observation at the time.
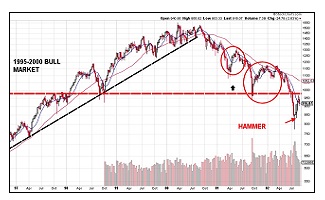
Chart 3: Four-Year Stock Chart (taken from our October 24 report)
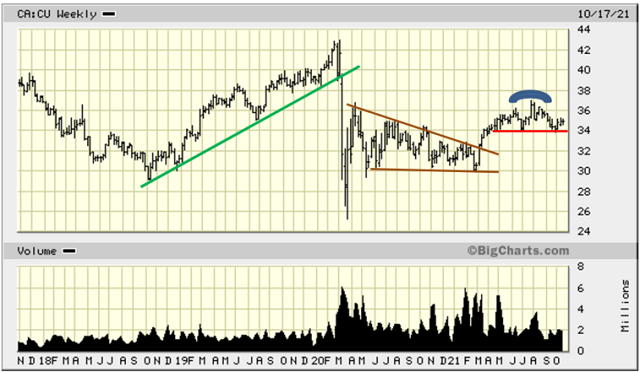
Observation: The GREEN up-trend line, which stretched from October 2018 until March 2020, clearly collapsed in the COVID-induced market tail-spin of early 2020. CU’s immediate recovery after the significant down-draft was typical of many stocks. However, CU then formed a descending triangle, as outlined by the BROWN trend lines. The break-out that occurred in early March 2020 saw the stock rise from around $32 to $37, where it stalled. As the BLUE arc shows, CU formed a Head-and-Shoulders pattern with the RED neckline holding firm at $34. A break below that shows Support at $32 and $30. Below that is a free-fall scenario.
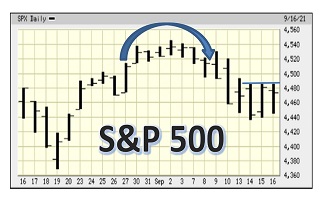
Comment: As our next chart shows, the Head-and-Shoulders pattern concluded last October and the stock has just continued to trade sideways since then.
Chart 4: Four-Year Stock Chart (October 2020 chart updated)
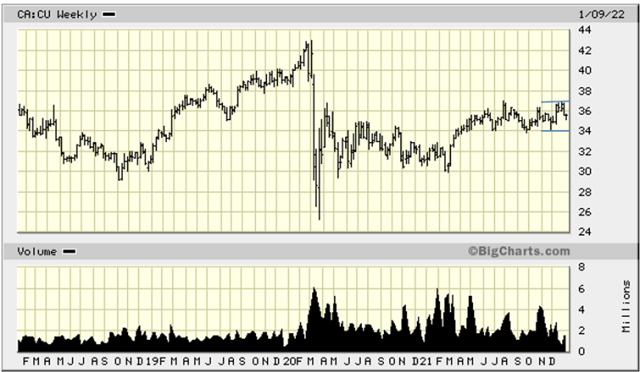
Observation: Such an elongated range-bound trading pattern needs to be resolved. Either the stock breaks through the $37 Resistance level or it goes back down to test Support at $30.
Let us revisit the two-year chart and look at it from a different perspective, which is that of the four-year chart that was in our October 2021 report.
Chart 5: Two-Year Stock Chart #2
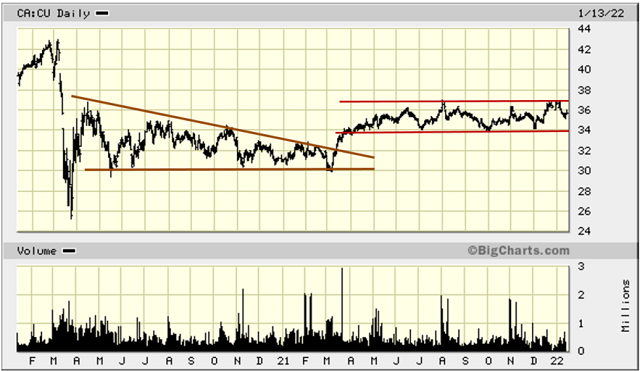
Observation: In Chart 5, above, we have broken the elongated rectangle shown in Chart 2 into two components, a descending triangle (brown lines) and a rectangle (rust lines). The triangle pattern was completed in March 2021, but the rectangle still has to be resolved.
Comment: So … what to do? The “technical” answer is to wait until the rectangle is resolved, one way or the other. The next chart shows possible price objectives, both on the downside and the upside. On the downside, a Stockholder would wait until Resistance at $30 was broken before selling. While waiting, even in the absence of any capital appreciation, the stock’s attractive (current) dividend yield of 4.9% is comforting. On the upside, a breakthrough at $37 portends further appreciation potential. Let us examine that scenario in Chart 6.
Chart 6: Five-Month Stock Chart
Observation: This chart, courtesy of “www.theuptrend.com, shows various upside and downside possible price objectives. This is a shorter-term chart compared to the ones we presented previously. An obvious upside target price is $36.72, which is the recent high “water-mark”, and close to the rectangle Resistance price of $37. If the stock breaks through this Resistance level, by extrapolation, after $37.11, the next upside targets are $37.50, $37.89, $38.28, $38.67, and $39.06. The ten-year chart below shows that CU is capable of attaining these prices, having done so before.
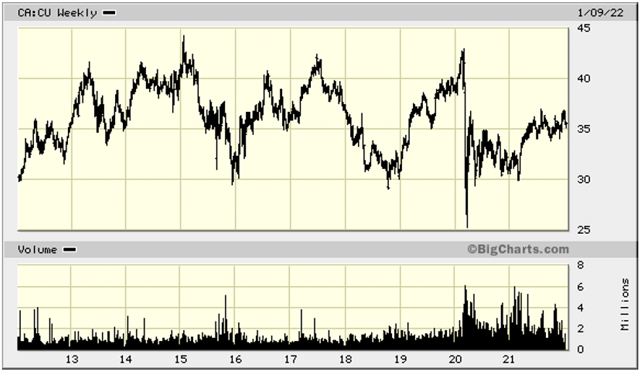
Chart 7: Ten-Year Stock Chart
Notes: All numbers in CAD unless otherwise stated. The author of this report, and employees, consultants, and family of eResearch may own stock positions in companies mentioned in this article and may have been paid by a company mentioned in the article or research report. eResearch offers no representations or warranties that any of the information contained in this article is accurate or complete. Articles on eresearch.com are provided for general informational purposes only and do not constitute financial, investment, tax, legal, or accounting advice nor does it constitute an offer or solicitation to buy or sell any securities referred to. Individual circumstances and current events are critical to sound investment planning; anyone wishing to act on this information should consult with a financial advisor. The article may contain “forward-looking statements” within the meaning of applicable securities legislation. Forward-looking statements are based on the opinions and assumptions of the Company’s management as of the date made. They are inherently susceptible to uncertainty and other factors that could cause actual events/results to differ materially from these forward-looking statements. Additional risks and uncertainties, including those that the Company does not know about now or that it currently deems immaterial, may also adversely affect the Company’s business or any investment therein. Any projections given are principally intended for use as objectives and are not intended, and should not be taken, as assurances that the projected results will be obtained by the Company. The assumptions used may not prove to be accurate and a potential decline in the Company’s financial condition or results of operations may negatively impact the value of its securities. Please read eResearch’s full disclaimer.