eResearch| The Santa Claus Rally Defined: Wikipedia defines the Santa Claus Rally as occurring during the last 5 trading days in December and the first 2 trading days in January, or 7 trading days in all. For 2021-2022, this would be from December 27 until January 4.
For this report, we are going to extend that period by one day at each end. That is because the U.S. exchanges observe different holiday days than do its Canadian counterparts. Thus, our Santa Claus Rally period runs from December 23 until January 5. This marks 9 trading days for the U.S. exchanges and 7 trading days for the Canadian exchanges.
Wikipedia quotes the 2019 Stock Trader’s Almanac, which states that the stock market has risen, on average, 1.3% during those 7 trading days going all of the way back to 1950. During these 7 trading days, the market has gone up 76% of the time.
This historic calendar effect is broadly attributed to one or more of the following postulations:
- Increased investor activity because of positive anticipation for the new year ahead;
- Lower trading activity from increased holiday vacations, which makes for greater volatility;
- The end of the tax-loss selling period and renewed confidence for the New Year; and
- Market pessimism, in general, is absent during the Christmas holiday period.
The 2021-2022 Rally Period
So, how did the latest Santa Claus rally fare this year?
As the following tables show, the Rally got off to a great start, then fizzled out as the period progressed, and ended up rather poorly.
Table 1: Major Indexes Closing Values, December 23, 2021 – January 5, 2022
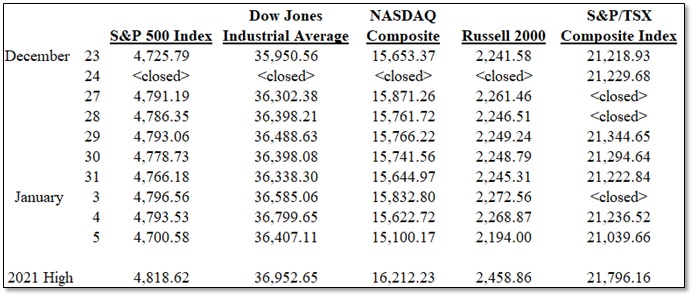
Table 2 shows the daily percentage changes in these Indexes.
Table 2: Percentage Daily Changes, Major Indexes, December 23, 2021 – January 5, 2022
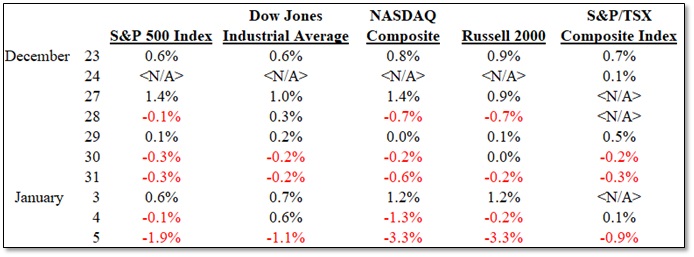
Observation: The table above shows a strong start to the Santa Claus Rally period in the first 2 trading days. Then, performance becomes a “mixed bag”, with more losing days than winning ones. The last 2 trading days were particularly weak.
Outlook
So, where do we go from here?
We believe that 2022 will be a much more difficult year for the markets. Our caution stems from our belief that, in 2022, corporate earnings, which are the backbone of market performance, are not likely to emulate the strong performance garnered in 2021. As a consequence, we think that it will be considerably more challenging to achieve excessive market returns.
Of course, there will be the usual sector rotation akin to the seasonality of market components. Readers are encouraged to read our monthly Seasonality Trends reports.
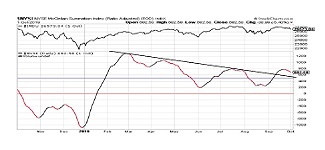
Historically, the stock market has performed well from October until May, and it usually does well in the Santa Claus Rally period and into January as Investors are filled with hope and positive expectations. Thus, the current “overbought” market may very well keep chugging along for a while, but we continue to believe that there will be a meaningful market pull-back this year.
Investors should remain cautious and consider taking profits when the opportunities arise or, certainly, when they become compelling.
Notes: All numbers in CAD unless otherwise stated. The author of this report, and employees, consultants, and family of eResearch may own stock positions in companies mentioned in this article and may have been paid by a company mentioned in the article or research report. eResearch offers no representations or warranties that any of the information contained in this article is accurate or complete. Articles on eresearch.com are provided for general informational purposes only and do not constitute financial, investment, tax, legal, or accounting advice nor does it constitute an offer or solicitation to buy or sell any securities referred to. Individual circumstances and current events are critical to sound investment planning; anyone wishing to act on this information should consult with a financial advisor. The article may contain “forward-looking statements” within the meaning of applicable securities legislation. Forward-looking statements are based on the opinions and assumptions of the Company’s management as of the date made. They are inherently susceptible to uncertainty and other factors that could cause actual events/results to differ materially from these forward-looking statements. Additional risks and uncertainties, including those that the Company does not know about now or that it currently deems immaterial, may also adversely affect the Company’s business or any investment therein. Any projections given are principally intended for use as objectives and are not intended, and should not be taken, as assurances that the projected results will be obtained by the Company. The assumptions used may not prove to be accurate and a potential decline in the Company’s financial condition or results of operations may negatively impact the value of its securities. Please read eResearch’s full disclaimer.