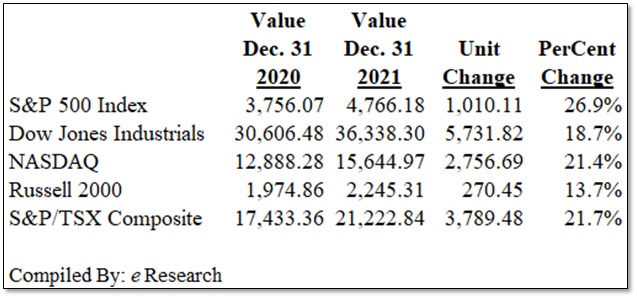
eResearch | There was a substantial gain in the market indexes this past year, to the pleasant surprise of many investors.
Figure 1: 2021 Index Performance
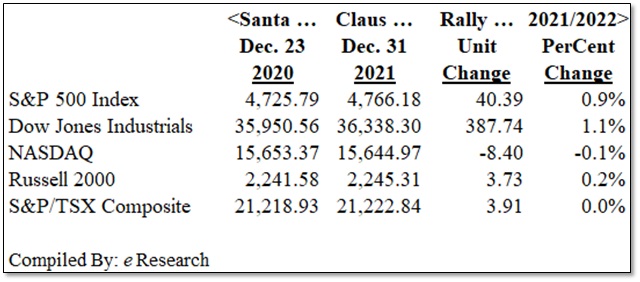
Last month, we wrote: “December benefits from the Santa Claus Rally.” December 2021 did not disappoint, …
Figure 2: December Index Performance
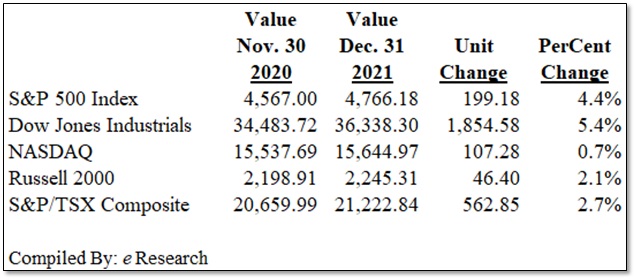
… but the last week of trading, which is the real Santa Claus Rally period, ended on a softer note.
Figure 3: Santa Claus Rally Performance
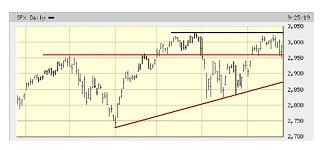
We also wrote last month: “January represents a “rebirth”, a “new start” with optimism and high expectations. But extraneous factors can upset the “apple cart”. Despite the market’s strong seasonality right now, after such a sustained up-move since March 2020, it really is time for a meaningful pause and pull-back.”
We consider a meaningful pull-back or correction in an index to be a decline of 10%-15% from its high, and more than 15% is a significant down-move.
COMMENT: After the substantial up-move this past year, a pull-back is badly needed. After a great year for corporate earnings (the principal driver for the stock market), a repeat performance in 2022 is highly unlikely. As a consequence, we advise that caution should be the hallmark of investment strategies for the year ahead. We further recommend that Investors be aware and strongly consider the seasonality aspects of the stock market. Our monthly Seasonality Trends reports can be very helpful in this regard.
Changes for January
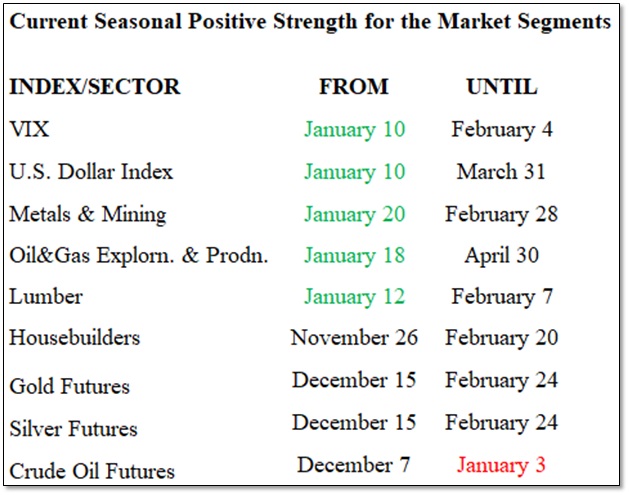
There are FIVE market indexes/sectors that exhibit new seasonal strength in January. These are as follows: VIX, U.S. Dollar Index, Oil&Gas Exploration & Production, Lumber, and Housebuilders. See the chart below.
The ONE sector that leaves its period of seasonality strength behind this month is Crude Oil Futures, and shown in the chart below.
There were THIRTY-ONE indexes/sectors that left during the month of December.
Seasonal Trends for the Market Segments in January
The following table shows which indexes/sectors gain or lose seasonal strength during the month of January. There are 5 additions this month, shown in GREEN under FROM, and there is 1 expiry this month, shown in RED under UNTIL.
NOTE: A full seasonality list of indexes and sectors is provided at the end of this report.
Figure 4: Current Seasonal Positive Strength for the Market Segments
Importance of Seasonality Trends
Seasonality refers to particular time-frames when stocks/sectors/indexes are subjected to and influenced by recurring tendencies that produce patterns that are apparent in the investment valuation process. A seasonality study preferably uses at least 10 years of data.
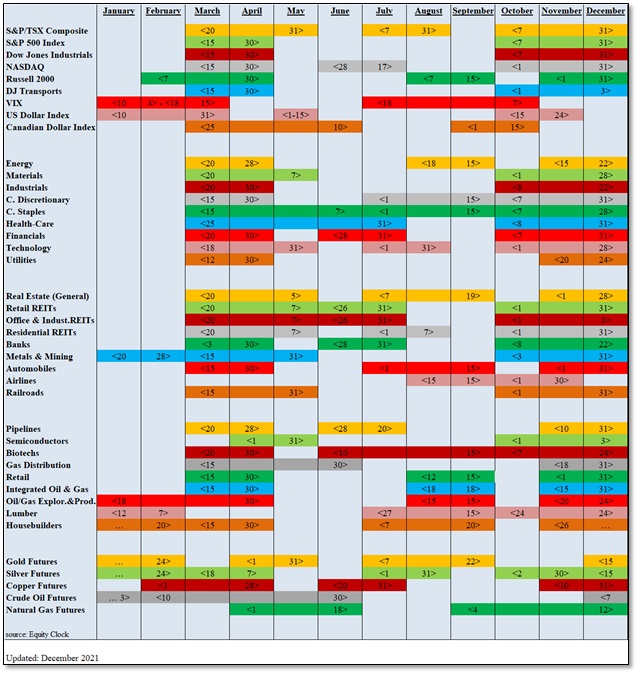
Seasonality Trends Chart
The Seasonality Trends chart below was updated this month (December 2021). The chart shows the periods of seasonal strength for 41 (formerly 38) market segments (sectors/indexes). Each bar indicates a buy and a sell date (start/end dates) based upon the optimal holding period for each market sector/index. Our update involved only a few minor tweaks to the start/end dates.
The three new additions this month are: (1) Canadian Dollar Index, (2) Lumber, and (3) Housebuilders.
The Seasonality Trends chart is an ever-changing 14-year average of the indexes and sub-indexes that we track. The information in the chart is courtesy of www.equityclock.com.
Figure 5: Seasonality Trends Chart
Notes: All numbers in CAD unless otherwise stated. The author of this report, and employees, consultants, and family of eResearch may own stock positions in companies mentioned in this article and may have been paid by a company mentioned in the article or research report. eResearch offers no representations or warranties that any of the information contained in this article is accurate or complete. Articles on eresearch.com are provided for general informational purposes only and do not constitute financial, investment, tax, legal, or accounting advice nor does it constitute an offer or solicitation to buy or sell any securities referred to. Individual circumstances and current events are critical to sound investment planning; anyone wishing to act on this information should consult with a financial advisor. The article may contain “forward-looking statements” within the meaning of applicable securities legislation. Forward-looking statements are based on the opinions and assumptions of the Company’s management as of the date made. They are inherently susceptible to uncertainty and other factors that could cause actual events/results to differ materially from these forward-looking statements. Additional risks and uncertainties, including those that the Company does not know about now or that it currently deems immaterial, may also adversely affect the Company’s business or any investment therein. Any projections given are principally intended for use as objectives and are not intended, and should not be taken, as assurances that the projected results will be obtained by the Company. The assumptions used may not prove to be accurate and a potential decline in the Company’s financial condition or results of operations may negatively impact the value of its securities. Please read eResearch’s full disclaimer.