eResearch│We have created a portfolio of high-payout equities that is focused primarily on attractive dividend yields but with some capital growth potential. Our performance since Inception on June 1, 20021 has been exceptional.
NOTE: The Dividend Yield Portfolio is designed with a longer-term perspective. As such, we update it every month-end, usually using the final Friday’s closing prices, whenever possible and appropriate. Essentially, it will be a Buy-and-Hold portfolio, with minimal trading involved. The Portfolio will be appropriately invested but, if circumstances warrant, there could be a sizable cash component. The Portfolio was initiated on June 1, 2021 with ten stocks. The initial investment, at inception, was $500,000. The maximum dollar amount invested in any one position is capped at $50,000. Net profit gains from the sale of stocks/ETFs can be used to invest in new, but not existing, equity positions.
TODAY’S PORTFOLIO COMMENT: The eResearch Dividend Yield Portfolio reached an all-time high of $559,026 on December 29, 2021. It closed the month and the year at $554,478. This represents a gain of 10.9% since Inception on June 1, 2021 from the $500,000 initial investment. For comparative purposes, the S&P/TSX Composite Index is up 7.6% since the Portfolio’s inception.
There was one addition made to the Portfolio during the month of December, and that was the purchase of Mullen Group Ltd. (TSX: MTL). Mullen was as high as $14.48 in mid-October, shortly after which it gapped down and did a swan-dive 24% to a low of $11.00 in mid-December. Satisfied its down-draft had been completed, we initiated purchase at $11.31 on December 14. But what really caught our attention was the Company’s announcement that it intended to increase its annual dividend by 25%, from $0.48 to $0.60 per share with the first monthly payment of $0.05 per share scheduled for its January ex-dividend date. This gives our purchase a going-in yield of 5.3%, with the reasonable prospect for a recovery in the share price. To date, the stock is ahead by 2.8% since purchase two weeks ago.
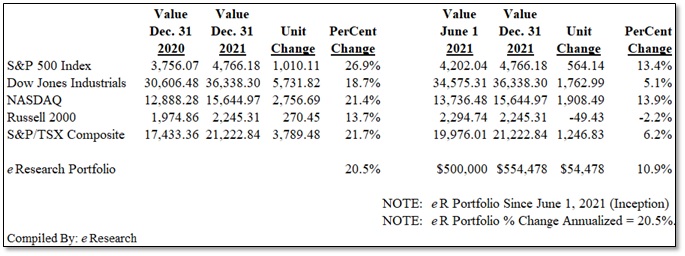
MARKET COMMENT: The year 2021 was a good one for stock market investors, as the Left Side of the following table shows. The S&P 500 Index led the way with a gain of 26.9%. The S&P/TSX Composite Index came next with a gain of 21.7%, with the NASDAQ Index not far behind with a gain of 21.4%. The eResearch Dividend Yield Portfolio returned 20.5%, not too shabby given its defensive focus on attaining yield.
The Right Side of the table below compares the performance of the eResearch Portfolio with the major indexes since the Portfolio’s Inception on June 1, 2021. The eResearch Portfolio gained 10.9% since Inception (or 20.5% annualized). The NASDAQ was the star performer in the second half of the year with a gain of 13.9%, the S&P 500 Index was up 13.4%, the S&P/TSX Composite Index gained 6.2%, the DJIA 5.1%, but the small-cap Russell 2000 actually declined 2.2%. Investors, in general, shunned the small caps in favour of the technology issues and the large cap growth stocks.
Figure 1: Major Indexes’ 2021 Performance (eResearch Portfolio included)
MARKET OUTLOOK: We believe that 2022 will be a year of “tough sledding” for the markets. We are not prone to making numerical predictions (a Mug’s Game, although Investors love prognosticators to stick their necks out), but we do think that it will be considerably more challenging to achieve excessive returns.
Of course, there will be the usual sector rotation akin to the seasonality of market components. Readers are encouraged to read our monthly Seasonality Trends reports.
We continue to believe that there will be a meaningful market pull-back this year, although these sentiments may have to be put into abeyance for a while, given that we are now in an historically strong period of market performance.
The eResearch Dividend Yield Portfolio, despite being highly defensive, has performed very well, and we expect it to continue doing so even if the market undergoes a general retreat.
Set out below is the eResearch Dividend Yield Portfolio, as at December 31, 2021:
Figure 2: Dividend Yield Portfolio – Constituents
COMMENT: Briefly, a few trading days ago, our Portfolio had no “losers”. However, Labrador Iron Ore Royalty Corp. (TSX: LIF) returned to “under water” status as the year closed out.
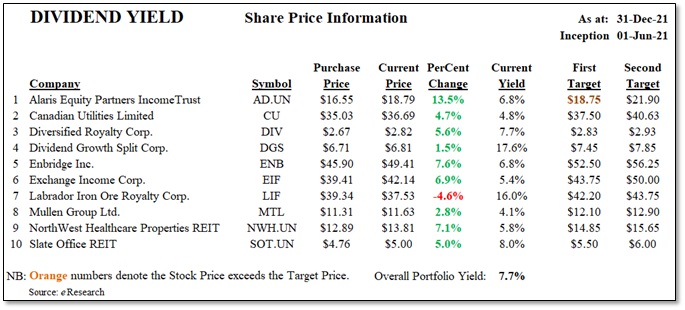
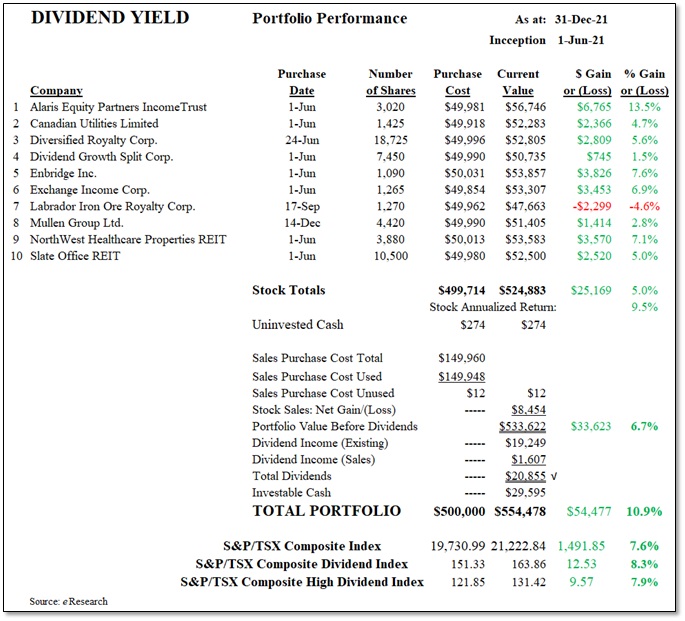
Our income-oriented portfolio emphasizes yield, as shown for the individual stock holdings. The Portfolio’s current yield is 7.7%. With its current 5.0% capital gain, the Portfolio is showing an impressive overall return of 10.9%. Our Portfolio is once again out-performing all of our comparatives (see below).
The Portfolio’s performance is provided in the following table.
Figure 3: Dividend Yield Portfolio – Performance
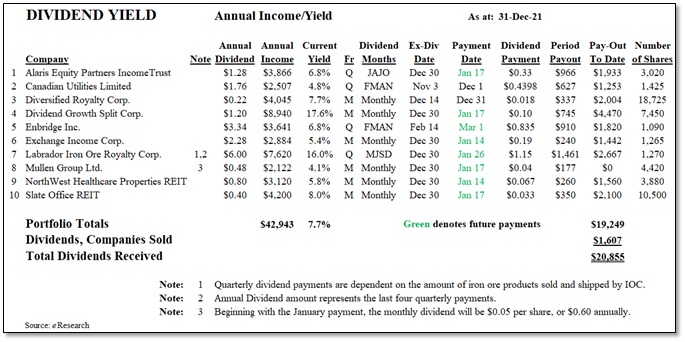
DIVIDEND INCOME/YIELD
Below, we provide a table that indicates the annual dividend, the corresponding annual income and current equity yields, and the dividend pay-outs to date since inception.
The Portfolio is currently yielding 7.7%.
Figure 4: Dividend Yield Portfolio – Income/Yield
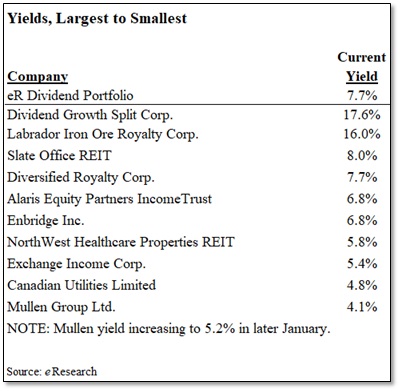
The next table lists the Portfolio’s dividend yields in descending order.
Figure 5: Dividend Yield Portfolio – Stock Yields
TOTAL RETURNS
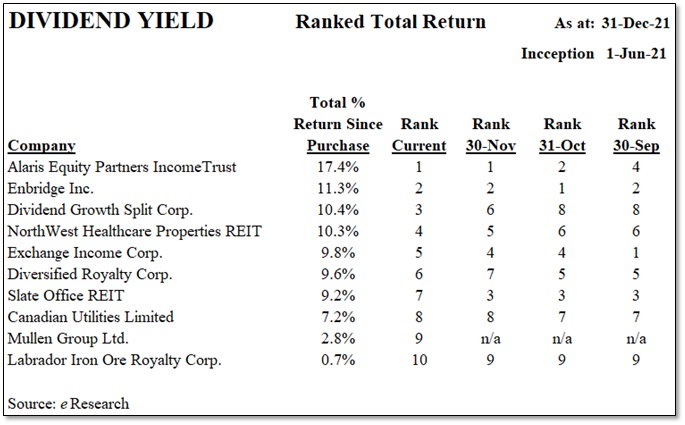
The first of the next two tables shows each stock holding’s capital gain/(loss) and annual dividend yield, and the second table shows the same information but put into a ranking order.
Figure 6: Dividend Yield Portfolio – Total Return
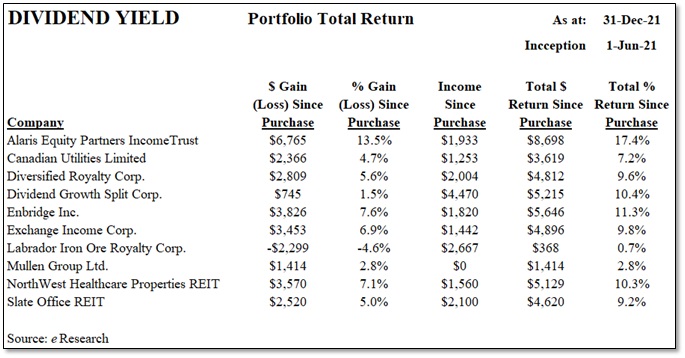
Figure 7: Dividend Yield Portfolio – Ranked Total Return
COMPARABLES
Since the Portfolio’s inception on June 1, 2021:
- the Portfolio is up 10.9%;
- the S&P/TSX Composite Index is ahead by 7.6%;
- the S&P/TSX Dividend Index is up 8.3% and the S&P/TSX High Dividend Index is ahead by 7.9%
- the ETFs range between 5.0% and 10.2%; and
- the Split Corps range between -4.1% and 9.9%.
All of these parameters have improved from a month ago.
In the next table, we compare the performance of the Portfolio against these aforementioned benchmarks, namely (a) the S&P/TSX Composite Index, the S&P/TSX Composite Dividend Index, and the S&P/TSX Composite High Dividend Index, (b) four selected higher-yield ETFs, and (c) eight notable Split Corps.
Figure 8: Dividend Portfolio – Comparatives
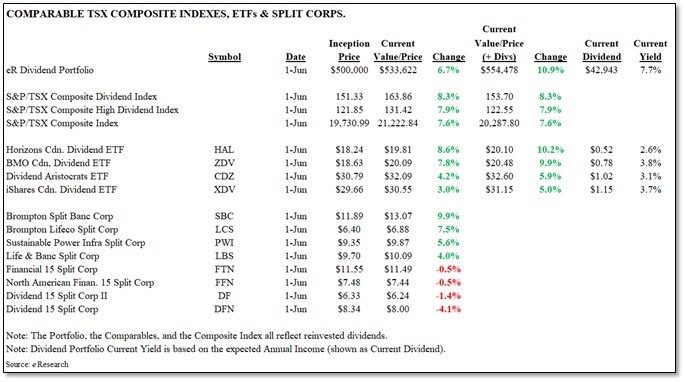
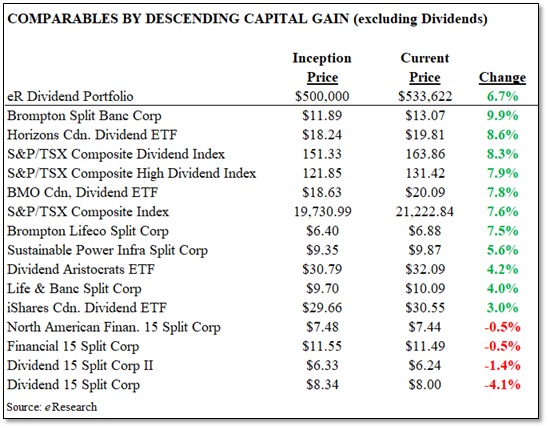
Figure 9: Portfolio – Comparatives Gains, EXCLUDING Dividends
We also show below the performance of the Portfolio against the respective ETFs and Indexes both in a table and then in graphical form.
The eResearch Portfolio has reclaimed the top spot amongst its comparatives with a return of 10.9% (see the arrow in the graph below). Horizons Canadian Dividend ETF (TSX: HAL) has slipped back to second place with a gain of 10.2%.
Figure 10: Dividend Yield Portfolio – Tabular Comparison
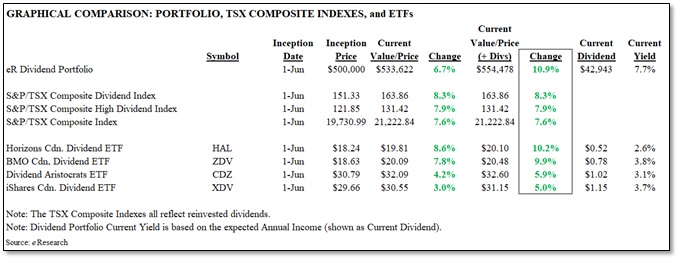
Figure 11: Dividend Yield Portfolio – Graphical Comparison
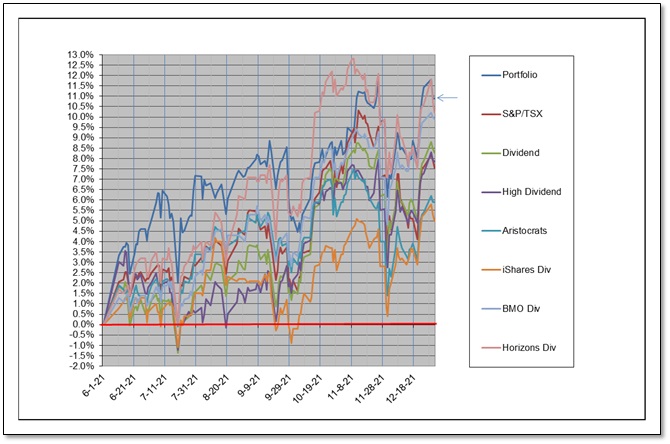
Figure 12: Top Ten Dividend Portfolio – Stocks Sold
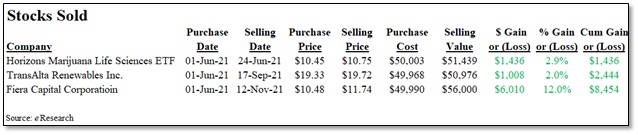
COMMENT: To date, we have sold three stocks from the Portfolio. Collectively, they have provided a cumulative Capital Gain of $8,454.
Notes: All numbers in CAD unless otherwise stated. The author of this report, and employees, consultants, and family of eResearch may own stock positions in companies mentioned in this article and may have been paid by a company mentioned in the article or research report. eResearch offers no representations or warranties that any of the information contained in this article is accurate or complete. Articles on eresearch.com are provided for general informational purposes only and do not constitute financial, investment, tax, legal, or accounting advice nor does it constitute an offer or solicitation to buy or sell any securities referred to. Individual circumstances and current events are critical to sound investment planning; anyone wishing to act on this information should consult with a financial advisor. The article may contain “forward-looking statements” within the meaning of applicable securities legislation. Forward-looking statements are based on the opinions and assumptions of the Company’s management as of the date made. They are inherently susceptible to uncertainty and other factors that could cause actual events/results to differ materially from these forward-looking statements. Additional risks and uncertainties, including those that the Company does not know about now or that it currently deems immaterial, may also adversely affect the Company’s business or any investment therein. Any projections given are principally intended for use as objectives and are not intended, and should not be taken, as assurances that the projected results will be obtained by the Company. The assumptions used may not prove to be accurate and a potential decline in the Company’s financial condition or results of operations may negatively impact the value of its securities. Please read eResearch’s full disclaimer.