eResearch | Utility stocks are generally perceived as defensive stocks, exhibiting attractive dividend yields with a modicum of upside potential in the stock price. Canadian Utilities Limited Class A Non-Voting Shares sport a yield of 5.0%. Trading exactly at the mid-point of the stock’s latest six-month range, as long as interest rates remain subdued, there could be some capital gain potential from current levels to add to the appealing dividend income.
The Company
Canadian Utilities Limited (TSX: CU) is 52.3% owned by holding company, ATCO Limited (TSX: ACO.X). Canadian Utilities is a diversified global energy infrastructure company. It delivers essential services and innovative business solutions to the following industries:
(1) Utilities, which includes electricity, and natural gas transmission and distribution, as well as international electricity operations;
(2) Energy Infrastructure, in which it is involved in electricity generation, energy storage, and industrial water solutions; and
(3) Retail Energy, which consists of electricity and natural gas retail sales.
The Company has approximately 4,470 employees. Its assets comprise about $20 billion.
Figure 1: Dividend Coverage
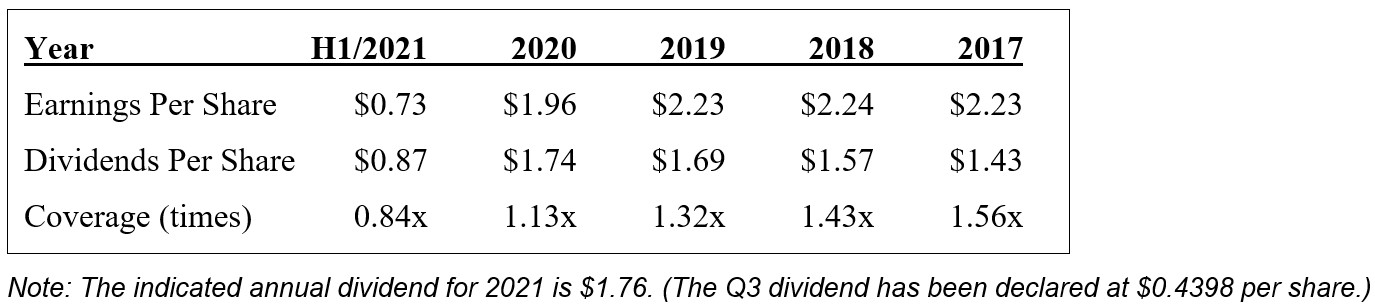
Figure 2: Ten-Year Chart
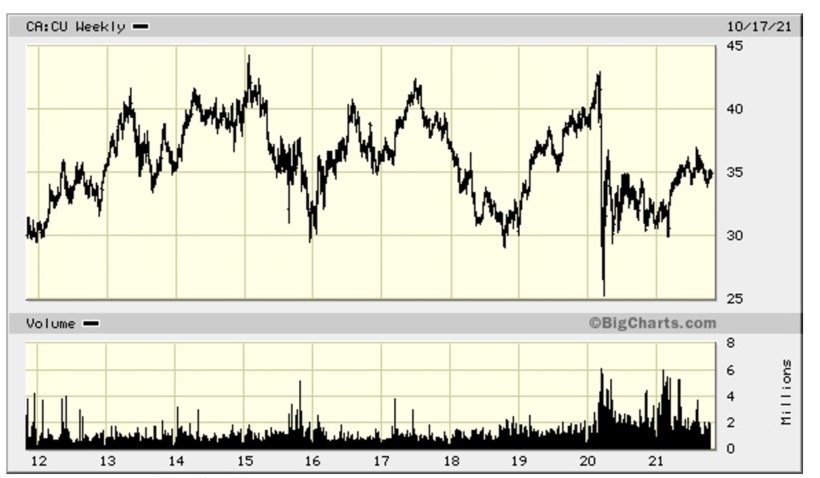
Observation: The ten-year chart shows a checkered past. During the last ten years, CU essentially has traded between $45 and $30; longer-term traders take note of this relatively narrow range. Currently, CU sits below the ten-year mid-point.
Figure 3: Four-Year Chart
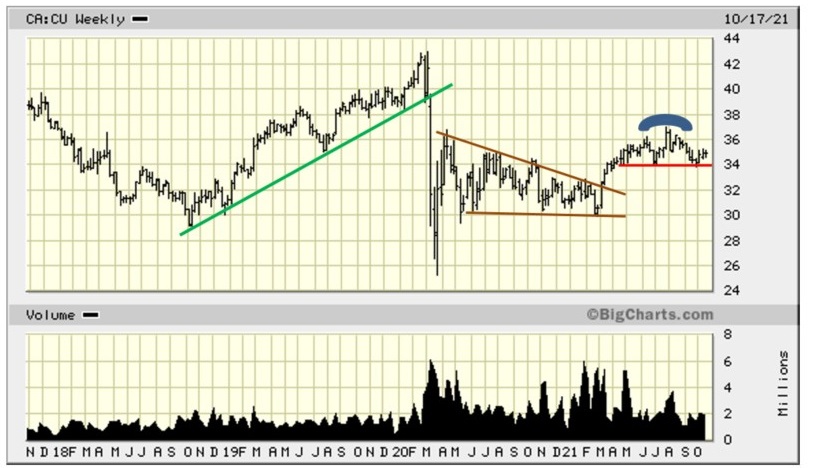
Observation: The GREEN up-trend line, which stretched from October 2018 until March 2020, clearly collapsed in the COVID-induced market tail-spin of early 2020. CU’s immediate recovery after the significant down-draft was typical of many stocks. However, CU then formed a descending triangle, as outlined by the BROWN trend-lines. The break-out that occurred in early March 2020 saw the stock rise from around $32 to $37, where it stalled. As the BLUE arc shows, CU formed a Head-and-Shoulders pattern with the RED neckline holding firm at $34. A break below that shows Support at $32 and $30. Below that is a free-fall scenario.
Figure 4: One-Year Chart
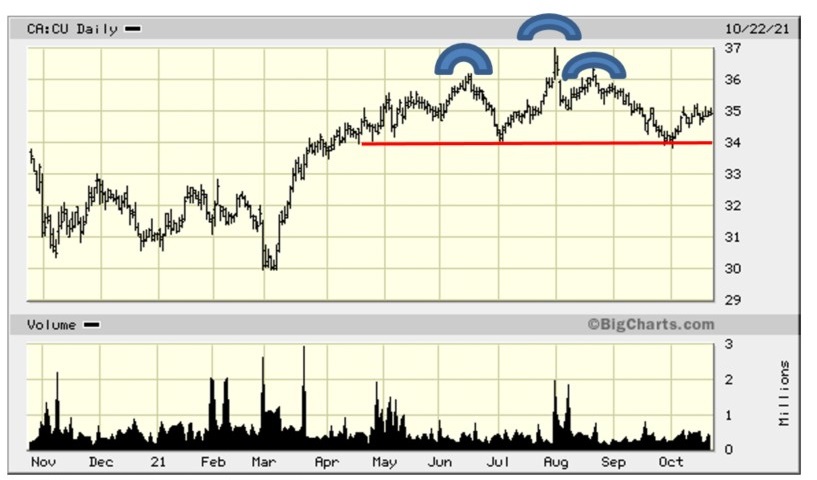
Observation: The one-year chart shows the Head-and-Shoulders more clearly, although the Right Shoulder is a little “deformed”, sort of like a “hunchback”. But, do you see the Cup & Handle on the right side of the chart?
Comment: At the end of this report, we provide some Notes on the Cup & Handle (C&H) technical pattern.
Figure 5: Six-Month Chart
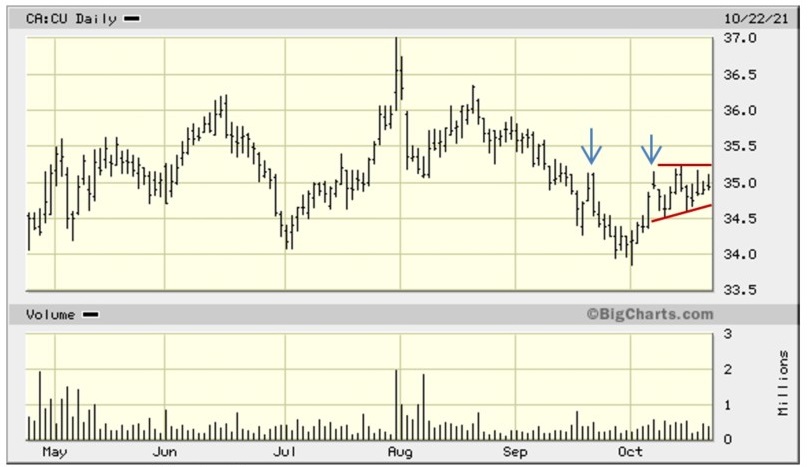
Observation: One of the stipulations for the validity of a Cup & Handle pattern is that, preferably, the C&H forms after the stock has experienced an up-move. The six-month chart does not show this, but a revisit to the one-year chart indicates that CU has been moving upwards since the beginning of March 2021 when the stock traded around $30.
C&H Formation: The Cup is delineated by the two arrows shown on the six-month chart, with the Handle still being formed within the Ascending Triangle that is delimited by the RUST trend-lines.
C&H Target Price: From the bottom of the Cup on October 1 at $33.86 to the top of the Cup on October 7 at $35.14, the stock gained $1.28. This number is then added to the break-out point on the Handle. Assuming that break-out price is the same as represented by the upper RUST trend-line in the Ascending Triangle of $35.22, then the upside target price is $35.22+$1.28, or $36.50.This represents a gain of 4.5% from the Friday, October 22 closing price of $34.94.
Another Target Price: A stock that reaches a certain price-point, and then declines, often exhibits a tendency to go back up and test the recent high. If CU were to do that, its gain to the recent high of exactly $37.00 on July 30 is 5.9% from current levels.
CONCLUSION: With its enticing current yield of 5.0%, CU remains primarily an attractive candidate for dividend-income-seeking investors. However, factoring in our possible capital appreciation potential of 4.5% or 5.9%, gives an overall 12-month total return of 9.5% to 10.9%. Of course, the stock could rise above the $37 target, enhancing the overall return even more.
Note: Canadian Utilities is one of the stocks included in the eResearch Top-Ten Dividend Yield Portfolio. You can access the October 2 report here: Top-Ten Dividend Yield Portfolio
Cup & Handle
There is a technical stock pattern that resembles a cup with a handle, where the cup is in the shape of a “U” and the handle has a slight downward slope. Although the cup and handle (C&H) pattern can work in declining or sideways movements, it usually represents a period of price consolidation during an up-trend. Resolution of the C&H formation is considered to be a bullish signal, often leading to higher prices.
C&H patterns are usually formed with the handle on the right, but there can be left-handled cups, too.
Here is what a C&H technical pattern looks like:
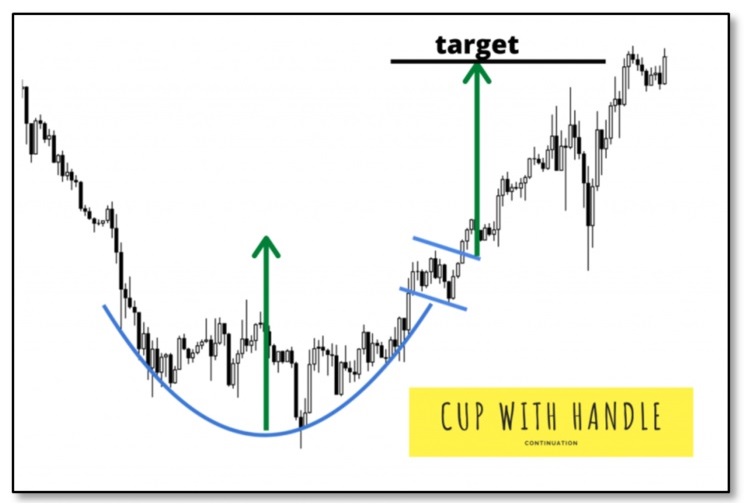
Figure 6: Typical Cup & Handle Technical Pattern
Cup & Handle Theory
- The Cup
The cup is created with the occurrence of general profit-taking or a broad market correction. The stock goes down and forms the left side of the cup. The cup bottom is formed when there are no more sellers at falling prices while, at the same time, astute buyers start to see opportunities and begin bidding the stock back up again.
- The Handle
As the stock goes up and forms the right side of the cup, it often fails to advance beyond the top of the cup. This then represents the top of the handle where it meets the cup. The handle forms by the stock declining, usually in a zig-zag fashion, until renewed buying pushes the stock back up again. The trend-line that forms at the top of the handle represents resistance that must be overcome. When latter-stage selling has concluded, the break-out from the handle occurs, which marks the end of the handle and the likely move to higher prices. The break-out from the handle usually works because, by now, the majority of the sellers have been accommodated and the buyers gain control.
Comments on the Pattern
- Cup and handle patterns are better probabilities if the general market is in an up-trend.
- The pattern works best if the stock also is in an up-trend since it shows historical demand and accumulation.
- A cup-with-handle base usually corrects 20% to 30% from the base’s left-side high. Most are three to six months long, but they can be as little as seven weeks or as long as a year or more.
- Look for a ‘U’ shape and share volume that lessens near the cup’s low. Volume that dries up at the bottom suggests funds have lost interest in selling. U-shaped bases are better than V-shaped.
- The C&H pattern has a higher probability of success if the break-out of the handle high happens on increasing volume. This indicates renewed interest from fund managers.
- The buy point is a momentum signal as the stock makes a new high inside the cup.
- A potential price target, as shown in Figure 6 above, is measured from the break-out from the handle to a point that is equi-distant from the bottom of the cup to the point of break-out from the handle.
- A price target could be between 20%-30% but the stock can go higher and, of course, it can also fall back in price and fail which is why a stop loss could be utilized.
Notes: All numbers in CAD unless otherwise stated. The author of this report, and employees, consultants, and family of eResearch personnel may own stock positions in companies mentioned in this article and may have been paid by a company mentioned in the article or research report. eResearch offers no representations or warranties that any of the information contained in this article is accurate or complete. Articles on eresearch.com are provided for general informational purposes only and do not constitute financial, investment, tax, legal, or accounting advice nor does it constitute an offer or solicitation to buy or sell any securities referred to. Individual circumstances and current events are critical to sound investment planning; anyone wishing to act on this information should consult with a financial advisor. The article may contain “forward-looking statements” within the meaning of applicable securities legislation. Forward-looking statements are based on the opinions and assumptions of the Company’s management as of the date made. They are inherently susceptible to uncertainty and other factors that could cause actual events/results to differ materially from these forward-looking statements. Additional risks and uncertainties, including those that the Company does not know about now or that it currently deems immaterial, may also adversely affect the Company’s business or any investment therein. Any projections given are principally intended for use as objectives and are not intended, and should not be taken, as assurances that the projected results will be obtained by the Company. The assumptions used may not prove to be accurate and a potential decline in the Company’s financial condition or results of operations may negatively impact the value of its securities. Please read eResearch’s full disclaimer.