eResearch│ We have created a portfolio of high-payout common stocks that is focused primarily on attractive dividend yields but with some capital growth potential.
OTE: The Top-Ten Dividend Yield Portfolio is designed with a longer-term perspective. As such, we update it every month, using the final Friday’s closing prices. Essentially, it will be a Buy-and-Hold portfolio, with minimal trading involved. The Portfolio will be appropriately invested but, if circumstances warrant, there could be a sizable cash component. The Portfolio was initiated on June 1, 2021, with ten stocks. The initial investment, at inception, was $500,000.
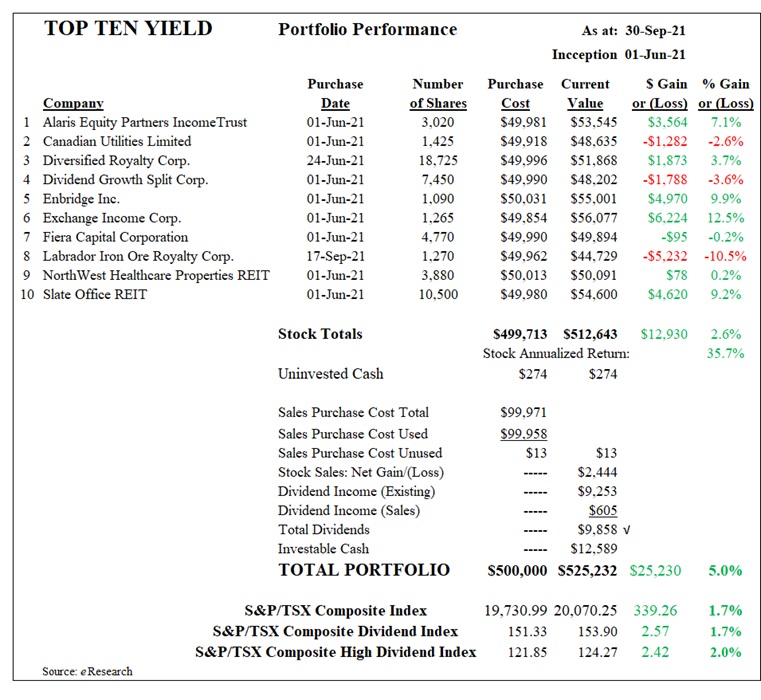
TODAY’S PORTFOLIO COMMENT: The value of the Portfolio at September 30, 2021 was $525,232, down 2.0% for the month, but still up 5.0% from the $500,000 initial investment. For comparative purposes, the S&P/TSX Composite Index dropped 2.5% during September but is ahead 1.7% since the Portfolio’s inception on June 1, 2021.
We performed a trade this past month, which turned out to be a mistake in terms of timing. We were unhappy to date with the appreciation performance of TransAlta Renewables (TSX: RNW) and, since it was yielding only 4.7%, the lowest rate in our Portfolio, we decided to sell it and switch to Labrador Iron Ore Royalty Corporation (TSX: LIF). Its yield is currently around 19%! At the time of the switch on September 17, LIF had declined 22.0% to our Purchase Price of $39.34 from its 2021 high of $50.45. The going-in yield for our Portfolio was 16.9%. It looked like an attractive switch and, six trading days later, we were ahead of the game. Then the wheels fell off. The market had a decent sell-off on Monday, September 27. LIF crashed, too. LIF closed September 30 at $35.22, translating to a decline of 10.5% since purchase just two weeks ago. Although all of the stocks in the Portfolio have declined in concert with the drop in the overall market, LIF is responsible for most of the carnage in our Portfolio over the last few days. We hope that we can report better times for LIF and its impact on our Portfolio in next month’s dissertation.
MARKET COMMENT: After a strong summer for stocks in 2021, the market was due for a retraction, a theme we have frequently espoused recently, including in our commentary last month.
October can be a volatile month for the stock market. Last October was not particularly good. The DJIA fell 4.6%, equivalent to about 1,280 points. The S&P 500 was off 3.4% for the month, the NASDAQ Composite fell 2.3%, and the S&P/TSX Composite Index was down 3.4%.
Historically, the S&P 500 Index has gained, on average, 0.8% in October. What distinguishes October is its volatility. Investors with long memories will know of, or remember, the Crash of October 1929 and the Crash of October 1987. Usually, as October draws to a close, the volatility moderates, and the Indexes set themselves up for the market’s usual strong period, which runs from about mid-October until the end of the following May.
One of the key reasons that we created the Dividend Yield Portfolio in June is our anticipation, and we were/are certainly not alone in this thinking, that there would be a market pull-back or at least a sustained market consolidation. This is now happening! All of the major Indexes are currently testing their mid-September low points. Breaking below these Support levels, if it happens, would likely lead to further market weakness.
OPINION: As October unfolds, Investors might want to take profits on Winners and keep the powder dry for quality companies that experience an unwarranted and temporary decline if and when the market suffers a downdraft. Investors are advised to position their portfolios for the traditional market “good times” that usually occur over the ensuing seven months.
Set out below is the eResearch Dividend Yield Portfolio, as of September 30, 2021:
Figure 1: Top Ten Dividend Portfolio – Constituents
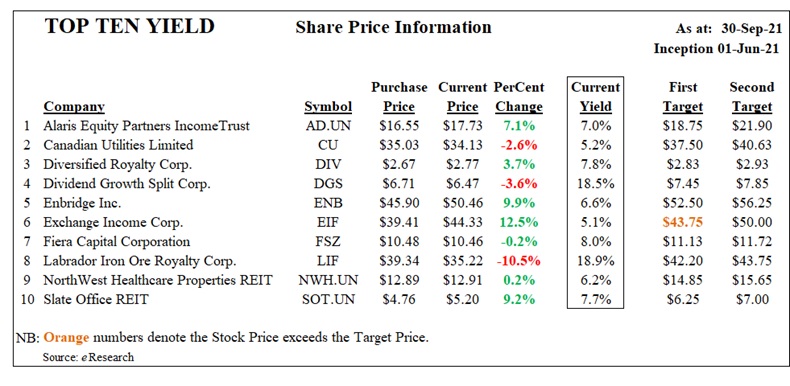
COMMENT: The Portfolio now has three stocks that are in the RED, with Labrador Iron Ore Royalty Corporation representing the major reason for the overall Portfolio’s decline this past month. LIF is down 10.5% currently. Having just gone ex-dividend on September 28 (payable October 26), the next ex-dividend date for its handsome yield is not until near the end of December. Also below cost at the end of September are Dividend Growth Split Corp. (TSX: DSG) and Canadian Utilities (TSX: CU). The top performers are Exchange Income Corporation (TSX: EIF), up 12.5%, Enbridge (TSX: ENB), up 9.9%, and Slate Office REIT (TSX: SOT.UN), up 9.2%. EIF is the only stock currently that has achieved its First Target Price.
The Portfolio’s performance is provided in the following table.
Figure 2: Top Ten Dividend Portfolio – Performance
COMPARABLES
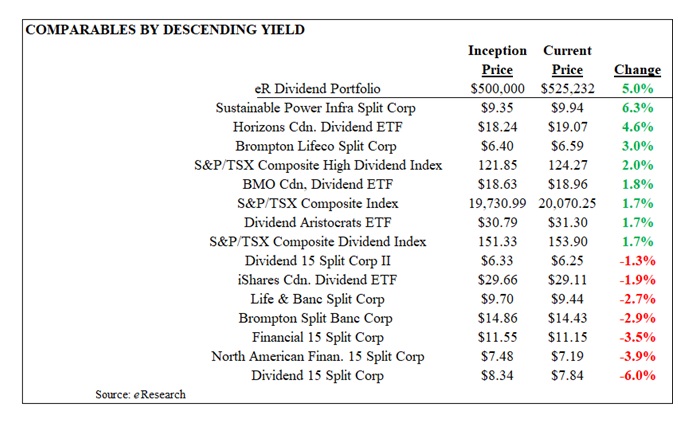
Since the Portfolio’s inception on June 1, 2021:
- the Portfolio is up 5.0%;
- the ETFs range between -1.9% and 4.6%;
- the Split Corps range between -6.0% and 6.3%;
- the S&P/TSX Composite Index is ahead by 1.7%; and
- the S&P/TSX Dividend Index is up 1.7% and the S&P/TSX High Dividend Index is ahead by 2.0%.
In the next table below, we compare the performance of the Portfolio against (a) four selected higher-yield ETFs, (b) eight notable Split Corps, and (c) the S&P/TSX Composite Index, the S&P/TSX Composite Dividend Index, and the S&P/TSX Composite High Dividend Index.
Figure 3: Top Ten Dividend Portfolio – Comparatives
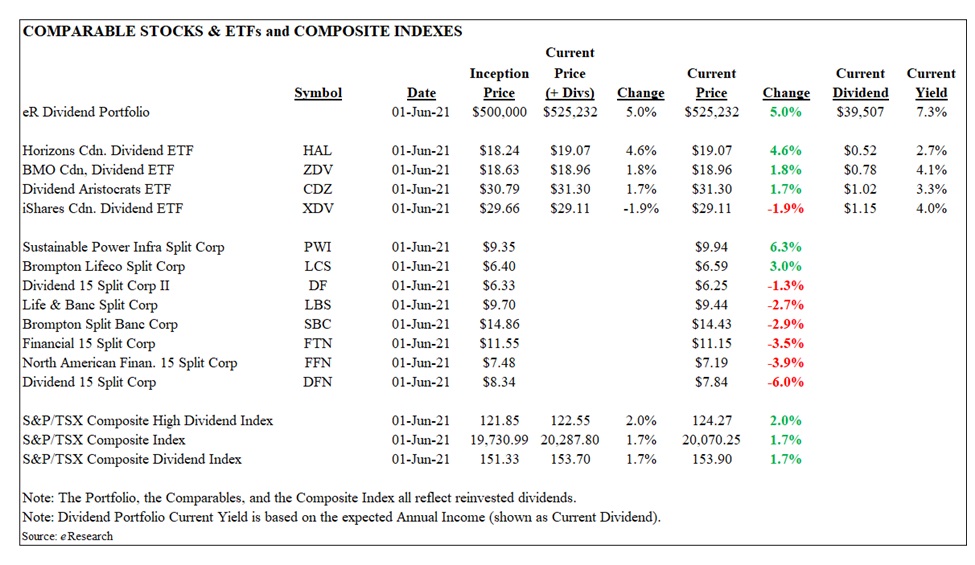
Figure 4: Top Ten Dividend Portfolio – Comparatives Gains
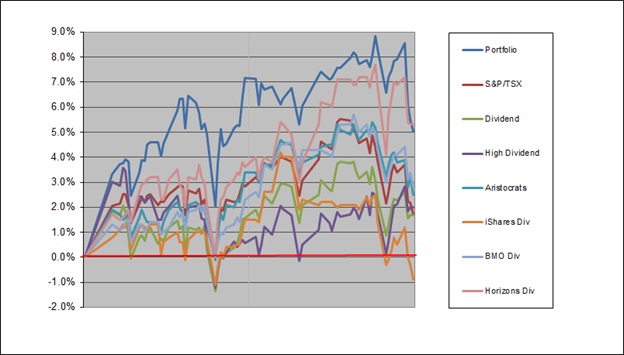
We also show the performance of the respective ETFs and Indexes in graphical form below.
Until very recently, the eResearch Portfolio, currently up 5.0%, was consistently the best performer in the comparison. Now the Horizons Canadian Dividend ETF (TSX: HAL), up 5.3%, is vying for the top spot and has actually taken over the lead with the highest return.
Figure 5: Top Ten Dividend Portfolio – Graphical Comparison
DIVIDEND INCOME/YIELD
Below, we provide a table that indicates the annual dividend, the corresponding annual income and current equity yields, and the dividend pay-outs to date since inception.
The Portfolio is currently yielding 7.3%.
Figure 6: Top Ten Dividend Portfolio – Income/Yield
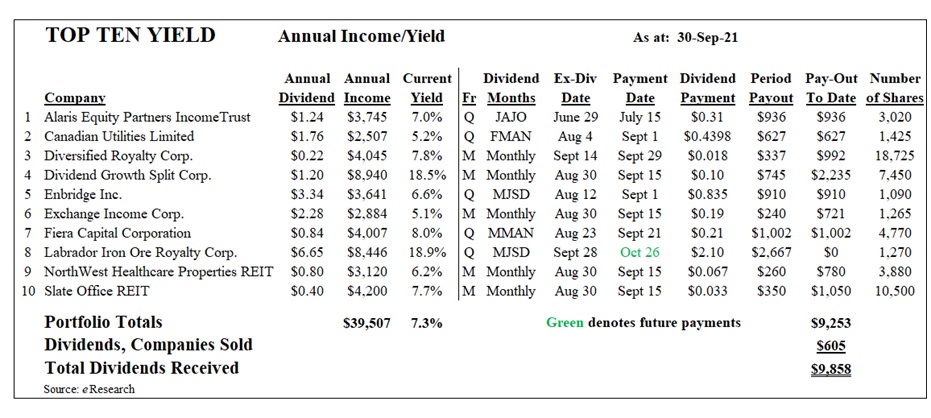
Figure 7: Top Ten Dividend Portfolio – Stocks Sold
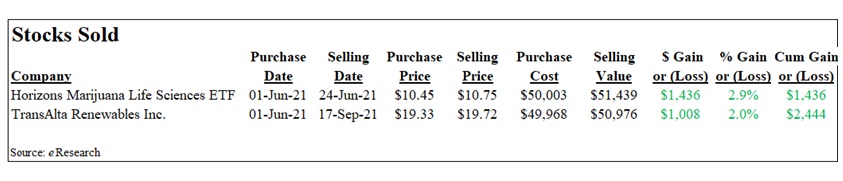
COMMENT: To date, we have sold only two stocks from the Portfolio. Collectively, they have provided a cumulative Capital Gain of $2,444.
Notes: All numbers in CAD unless otherwise stated. The author of this report, and employees, consultants, and family of eResearch may own stock positions in companies mentioned in this article and may have been paid by a company mentioned in the article or research report. eResearch offers no representations or warranties that any of the information contained in this article is accurate or complete. Articles on eresearch.com are provided for general informational purposes only and do not constitute financial, investment, tax, legal, or accounting advice nor does it constitute an offer or solicitation to buy or sell any securities referred to. Individual circumstances and current events are critical to sound investment planning; anyone wishing to act on this information should consult with a financial advisor. The article may contain “forward-looking statements” within the meaning of applicable securities legislation. Forward-looking statements are based on the opinions and assumptions of the Company’s management as of the date made. They are inherently susceptible to uncertainty and other factors that could cause actual events/results to differ materially from these forward-looking statements. Additional risks and uncertainties, including those that the Company does not know about now or that it currently deems immaterial, may also adversely affect the Company’s business or any investment therein. Any projections given are principally intended for use as objectives and are not intended, and should not be taken, as assurances that the projected results will be obtained by the Company. The assumptions used may not prove to be accurate and a potential decline in the Company’s financial condition or results of operations may negatively impact the value of its securities. Please read eResearch’s full disclaimer.