eResearch│ We have created a portfolio of high-payout common stocks that is focused primarily on attractive dividend yields but with some capital growth potential.
NOTE: The Top-Ten Dividend Yield Portfolio is designed with a longer-term perspective. As such, we update it every month, using the final Friday’s closing prices. Essentially, it will be a Buy-and-Hold portfolio, with minimal trading involved. The Portfolio will be appropriately invested but, if circumstances warrant, there could be a sizable cash component. The Portfolio was initiated on June 1, 2021 with ten stocks. The initial investment, at inception, was $500,000.
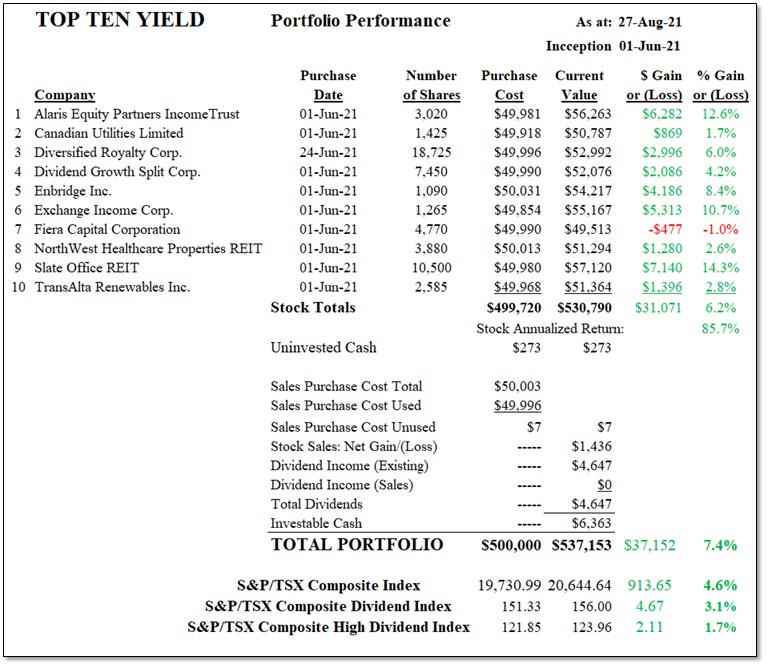
TODAY’S PORTFOLIO COMMENT: The value of the Portfolio on August 27 was $537,153, up 7.4% from the $500,000 initial investment. For comparative purposes, the S&P/TSX Composite Index gained 4.6% since inception.
MARKET COMMENT: One of the key reasons that we created the Dividend Yield Portfolio in June was our anticipation, and we were certainly not alone in this thinking, that there would be a market pull-back or at least a sustained market consolidation. This has not yet happened!
When defensive sectors of the market (for example, utilities, consumer staples, heath-care, and real estate) perform well against other market indexes, it can mean that investors are worried about the future direction of the market. This would normally lead to a shift in stock positions from the “growth” areas to the “value” areas.
In the August 17, 2021 Thackray Report, Brook Thackray provides a chart (shown below) of a combination of Utilities, Consumer Staples, Healthcare, and Real Estate ETFs, equally weighted, and compares this combo to the S&P 500 Index. (Source: https://alphamountain.com)
FIGURE 1: Equally-Weighted Portfolio of Utilities, Consumer Staples, Healthcare, and Real Estate ETFs versus the S&P 500 Index
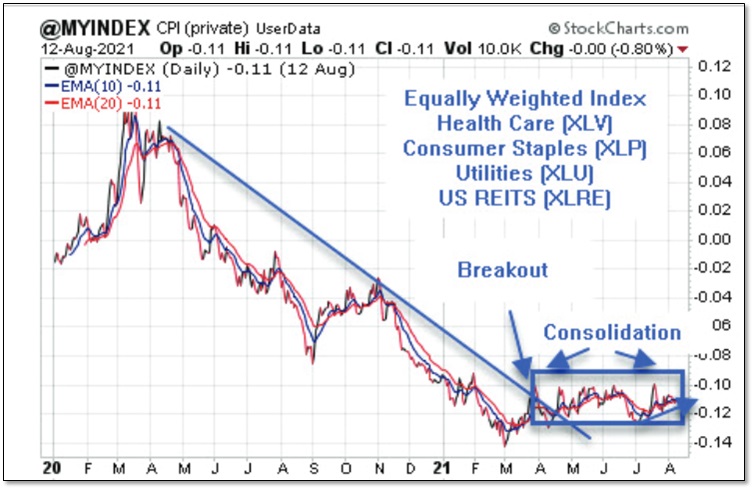
The one-year down-trend line that ended in March 2021 was broken to the upside the next month and has been in a consolidation phase ever since. This out-performance of the defensive sector against the broad market illustrates some investors thinking that the overall market has peaked or is about to peak. To date, that thinking has been premature.
Set out below is the eResearch Dividend Yield Portfolio, as of August 27, 2021.
FIGURE 2: Top 10 Dividend Portfolio Constituents
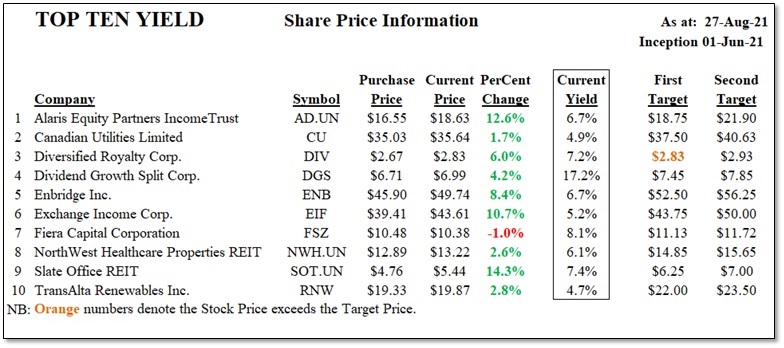
COMMENT: The Portfolio still has only one stock that is in the RED, and only by 1.0%. However, last month the loser was Dividend Growth Split Corp. and this month it is Fiera Capital Corporation (TSX:FSZ). Diversified Royalty Corp. is still the only stock that has achieved its First Target Price. The top performers are Slate Office REIT (TSX:SOT.UN), up 14.3%, and Alaris Equity Partners Income Trust (TSX:AD.UN), up 12.6%.
The Portfolio’s performance is provided in the following table.
FIGURE 3: Top 10 Dividend Portfolio Performance
COMPARABLES
Since the Portfolio’s inception on June 1, 2021:
- the eResearch’s Dividend Portfolio is up 7.4%;
- ETFs are up between 2.2% and 6.2%;
- Split Corps have risen between -0.6% and 5.1%;
- the S&P/TSX Composite Index is ahead by 4.6%; and
- the S&P/TSX Dividend Index is up 3.1% and the S&P/TSX High Dividend Index is ahead by 1.7%.
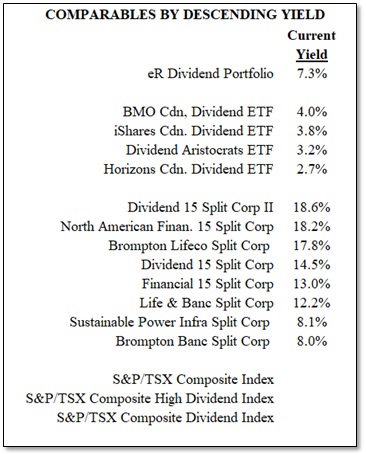
In the next table below, we compare the performance of the Portfolio against (a) four selected higher-yield ETFs, (b) eight notable Split Corps, and (c) the S&P/TSX Composite Index, the S&P/TSX Composite Dividend Index, and the S&P/TSX Composite High Dividend Index.
FIGURE 4: Top 10 Dividend Portfolio Comps
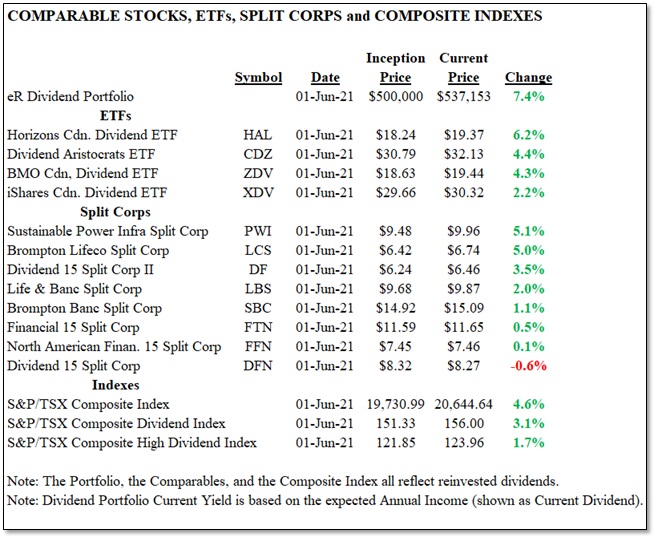
FIGURE 5: Top 10 Dividend Portfolio Comps by Yield
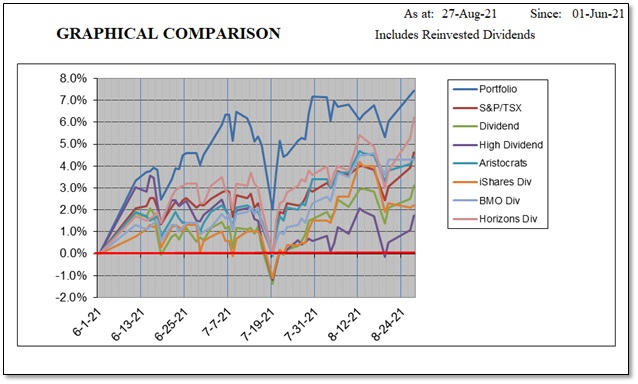
We also show the performance of the respective ETFs and Indexes in graphical form below.
The eResearch Dividend Portfolio is, by far, the best performer (+7.4%). The Horizons Canadian Dividend ETF is in second place (+6.2%), while third is occupied by the S&P/TSX Composite Index (+4.6%).
FIGURE 6: Top 10 Dividend Portfolio Comps – Graphical Comparison
DIVIDEND INCOME/YIELD
Below, we provide a table that indicates the annual dividend, the corresponding annual income and current equity yields, and the dividend pay-outs to date since inception.
The eResearch Dividend Portfolio is currently yielding 7.3%.
FIGURE 7: Top 10 Dividend Portfolio Comps – Graphical Comparison
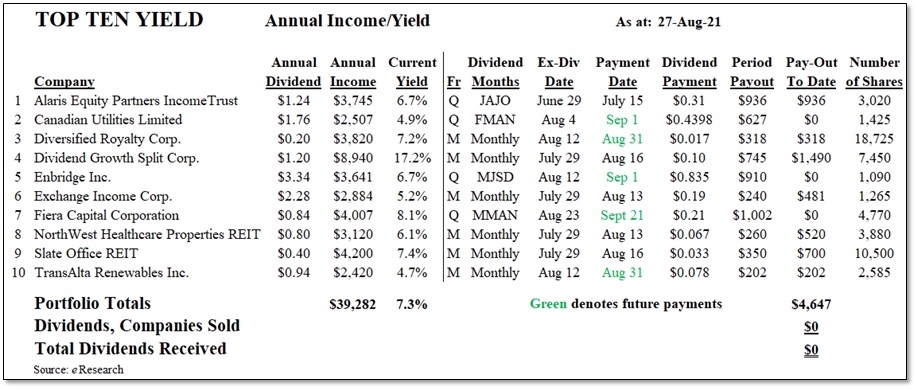
FIGURE 8: Top 10 Dividend Portfolio – STOCKS SOLD

Notes: All numbers in CAD unless otherwise stated. The author of this report, and employees, consultants, and family of eResearch may own stock positions in companies mentioned in this article and may have been paid by a company mentioned in the article or research report. eResearch offers no representations or warranties that any of the information contained in this article is accurate or complete. Articles on eresearch.com are provided for general informational purposes only and do not constitute financial, investment, tax, legal, or accounting advice nor does it constitute an offer or solicitation to buy or sell any securities referred to. Individual circumstances and current events are critical to sound investment planning; anyone wishing to act on this information should consult with a financial advisor. The article may contain “forward-looking statements” within the meaning of applicable securities legislation. Forward-looking statements are based on the opinions and assumptions of the Company’s management as of the date made. They are inherently susceptible to uncertainty and other factors that could cause actual events/results to differ materially from these forward-looking statements. Additional risks and uncertainties, including those that the Company does not know about now or that it currently deems immaterial, may also adversely affect the Company’s business or any investment therein. Any projections given are principally intended for use as objectives and are not intended, and should not be taken, as assurances that the projected results will be obtained by the Company. The assumptions used may not prove to be accurate and a potential decline in the Company’s financial condition or results of operations may negatively impact the value of its securities. Please read eResearch’s full disclaimer.