eResearch│ We have created a portfolio of high-payout common stocks that is focused primarily on attractive dividend yields but with some capital growth potential.
NOTE: The Top-Ten Dividend Yield Portfolio is designed with a longer-term perspective. As such, we update it every month-end, usually using the final Friday’s closing prices. Essentially, it will be a Buy-and-Hold portfolio, with minimal trading involved. The Portfolio will be appropriately invested but, if circumstances warrant, there could be a sizable cash component. The Portfolio was initiated on June 1, 2021, with ten stocks. The initial investment, at inception, was $500,000.
TODAY’S PORTFOLIO COMMENT: The value of the Portfolio reached an all-time high of $558,712 on November 25, 2021. Three days later, it was down 4.2% to close the month at $535,265. This is still up 7.1% since inception from the $500,000 initial investment. For comparative purposes, the S&P/TSX Composite Index is down 5.2% from its all-time high reached on November 16 but is ahead by 4.7% since the Portfolio’s inception on June 1, 2021.
There was one change made to the Portfolio during the month of November, and that was the sale of Fiera Capital Corporation. After languishing for most of the time since inception (but with an excellent dividend yield), we took advantage of an unexpected flurry in the stock price on November 12 to notch a 12.0% capital gain. (Since our sale, the stock has fallen 11.0%, and to a price slightly below our original Purchase Price.).
MARKET COMMENT: November, typically, is not a strong performance month for the stock market. This year, November was going fairly well, until the wheels fell off.
The following table depicts what happened to shell-shocked investors:
Figure 1: Recent Major Indexes’ Performance (eResearch Portfolio included)
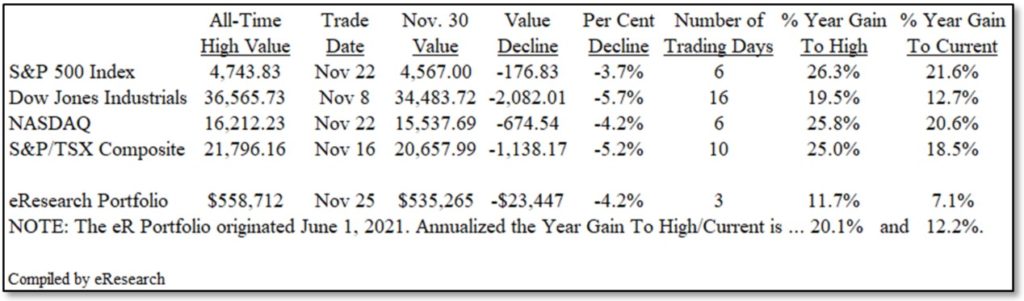
Even after the recent precipitous decline, the major indexes are still up handsomely for the year. December is typically a good month with the expected “Santa Claus Rally”, leading into what historically is a good January, so further gains may be in store.
However, we do not expect 2022 to mirror the excellent performance experienced in 2021. Highly successful stock-picking will likely be much more problematic.
We have been sounding the alarm for some time that a market pull-back was in order, almost to the point where we were starting to second guess ourselves. But, time and time again, the best returns are achieved by sticking with one’s convictions, provided those convictions are soundly based. In this respect, our dividend portfolio is highly defensive. Still, it was pulled down just as easily as the indexes.
Against that background, let us have a look at how we fared during this volatile month.
Set out below is the eResearch Dividend Yield Portfolio, as of November 30, 2021:
Figure 2: Top Ten Dividend Portfolio – Constituents
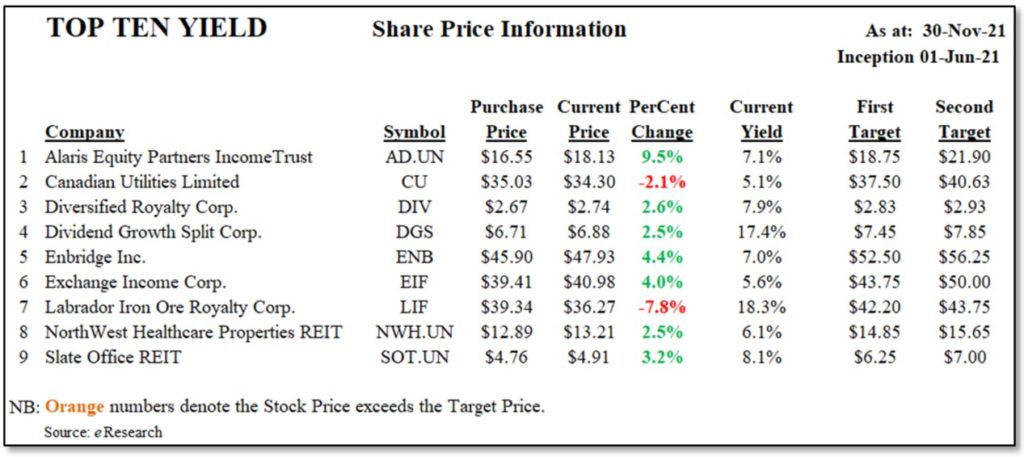
COMMENT: The Portfolio has two stocks that are “underwater”, those stocks being Canadian Utilities Limited (TSX: CU) and Labrador Iron Ore Royalty Corporation (TSX: LIF). Our income-oriented portfolio emphasizes yield, as shown. However, we have been fortunate in achieving an impressive capital gains performance, which has greatly enhanced our overall return, now 7.1%, but down from 8.2% last month.
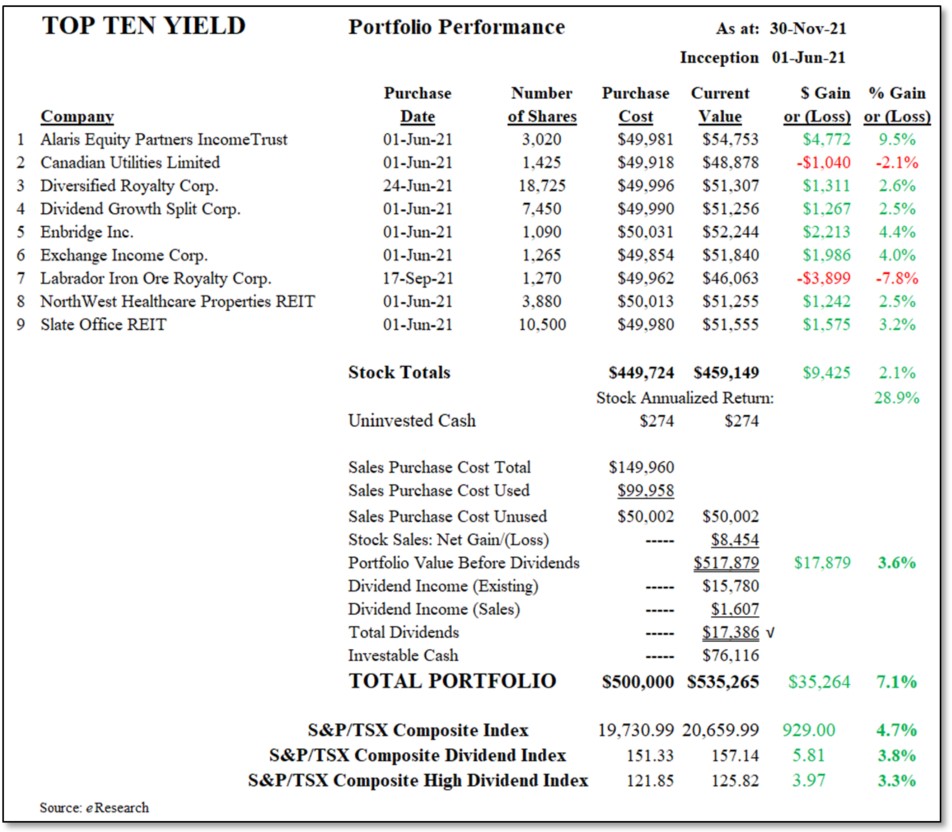
The Portfolio’s performance is provided in the following table.
Figure 3: Top Ten Dividend Portfolio – Performance
COMPARABLES
Since the Portfolio’s inception on June 1, 2021:
- the Portfolio is up 7.1%;
- the S&P/TSX Composite Index is ahead by 4.7%;
- the S&P/TSX Dividend Index is up 3.8% and the S&P/TSX High Dividend Index is ahead by 3.3%
- the ETFs range between -1.2% and 5.5%; and
- the Split Corps range between -4.6% and 5.3%.
All of these parameters are well down from a month ago.
In the next table, we compare the performance of the Portfolio against these aforementioned benchmarks, namely (a) the S&P/TSX Composite Index, the S&P/TSX Composite Dividend Index, and the S&P/TSX Composite High Dividend Index, (b) four selected higher-yield ETFs, and (c) eight notable Split Corps.
Figure 4: Top Ten Dividend Portfolio – Comparatives
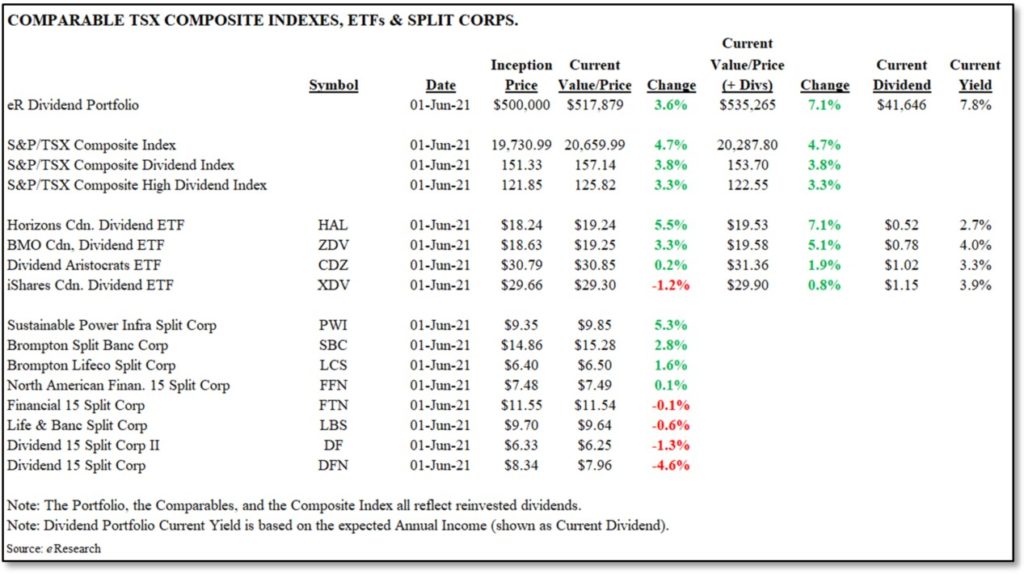
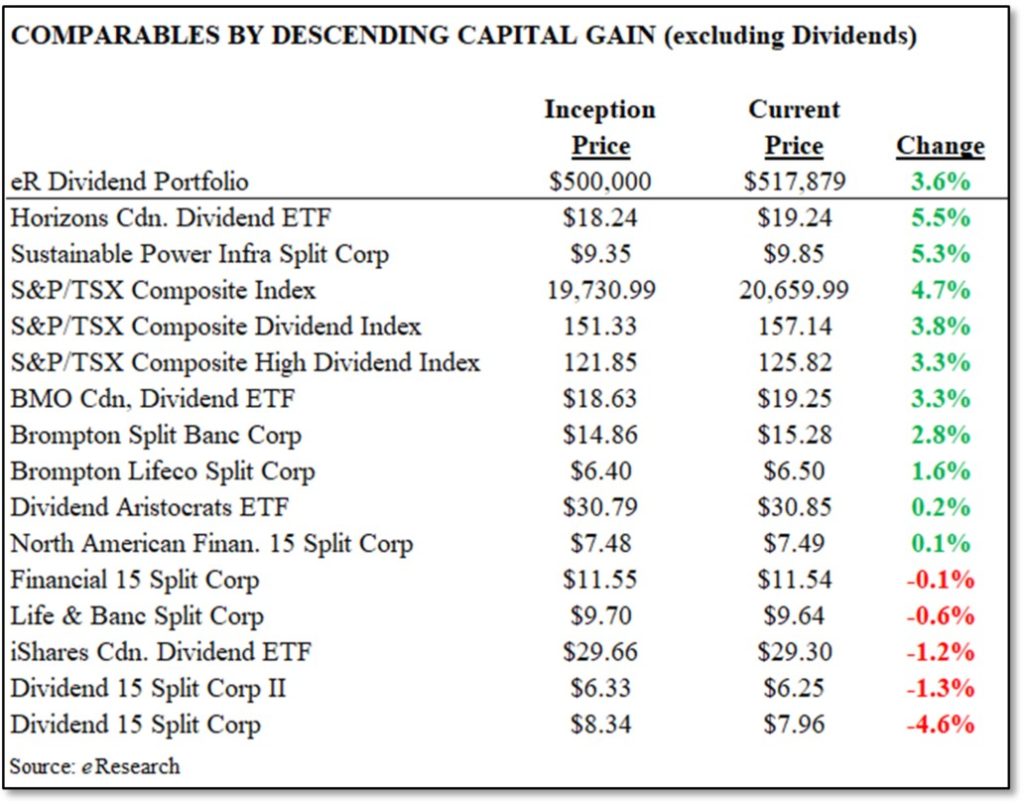
Figure 5: Top Ten Dividend Portfolio – Comparatives Gains, EXCLUDING Dividends
We also show below the performance of the Portfolio against the respective ETFs and Indexes both in a table and then in graphical form.
Until recently, the eResearch Portfolio was consistently the best performer in the comparison. Then, Horizons Canadian Dividend ETF (TSX: HAL) took over. However, this week’s pull-back impacted HAL quite significantly, such that both the eResearch Portfolio and HAL are now tied with a total return of 7.1% since our Portfolio’s inception.
Figure 6: Top Ten Dividend Portfolio – Tabular Comparison
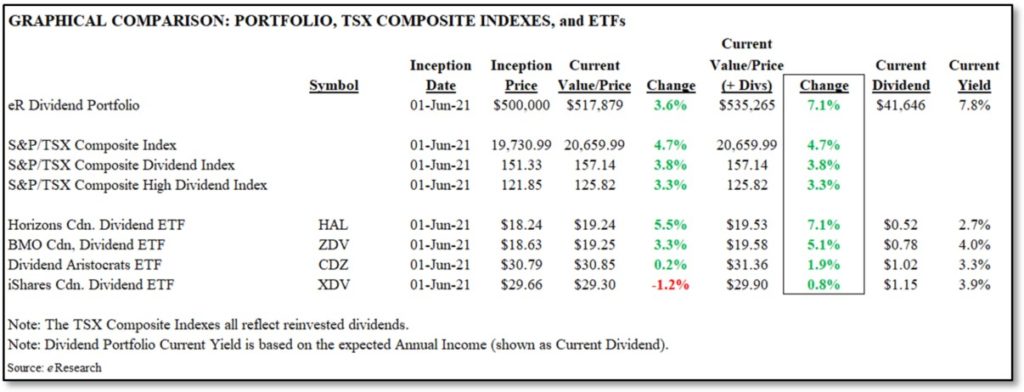
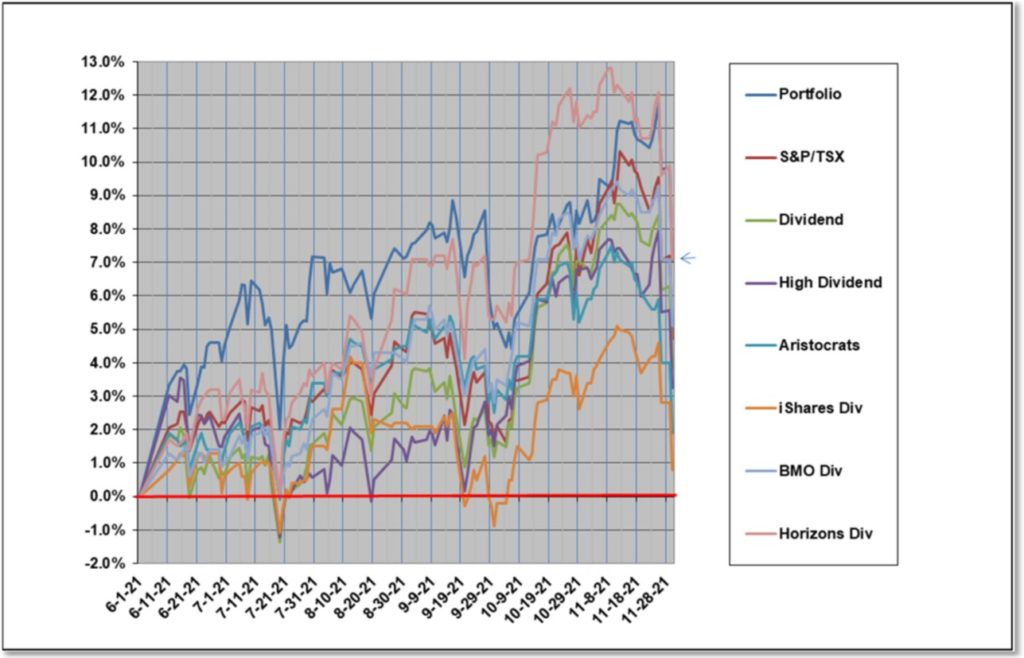
Figure 7: Top Ten Dividend Portfolio – Graphical Comparison
DIVIDEND INCOME/YIELD
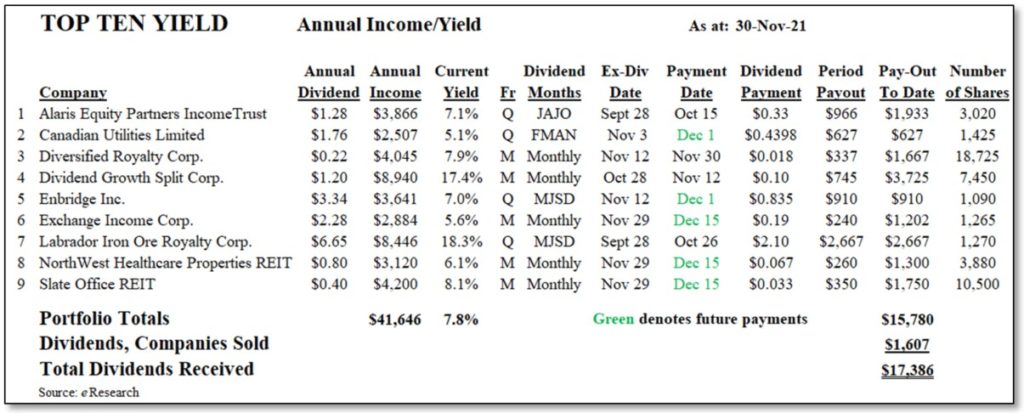
Below, we provide a table that indicates the annual dividend, the corresponding annual income and current equity yields, and the dividend pay-outs to date since inception.
The Portfolio is currently yielding 7.8%.
Figure 8: Top Ten Dividend Portfolio – Income/Yield
The next table lists the Portfolio’s dividend yields in descending order.
Figure 9: Top Ten Dividend Portfolio – Stock Yields
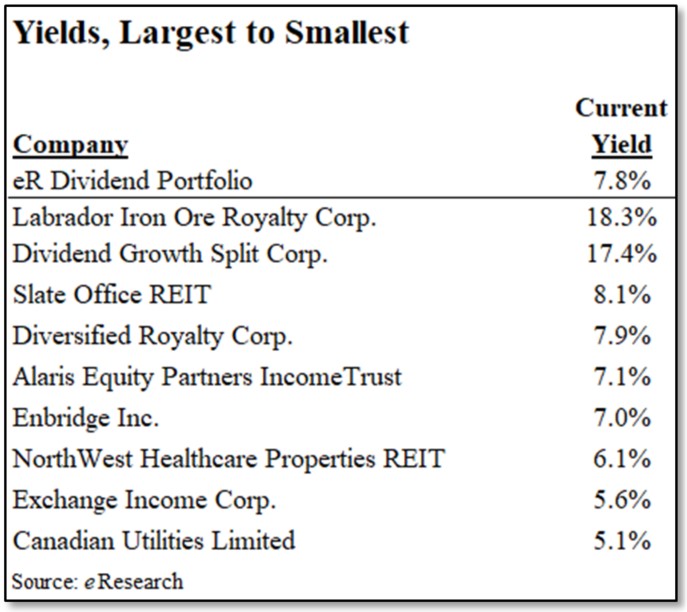
Figure 10: Top Ten Dividend Portfolio – Stocks Sold
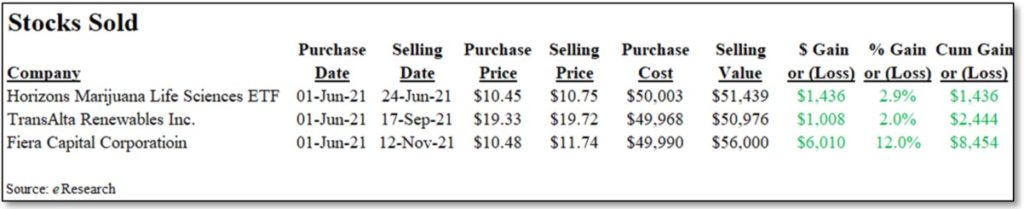
COMMENT: To date, we have sold three stocks from the Portfolio. Collectively, they have provided a cumulative Capital Gain of $8,454.
Notes: All numbers in CAD unless otherwise stated. The author of this report, and employees, consultants, and family of eResearch may own stock positions in companies mentioned in this article and may have been paid by a company mentioned in the article or research report. eResearch offers no representations or warranties that any of the information contained in this article is accurate or complete. Articles on eresearch.com are provided for general informational purposes only and do not constitute financial, investment, tax, legal, or accounting advice nor does it constitute an offer or solicitation to buy or sell any securities referred to. Individual circumstances and current events are critical to sound investment planning; anyone wishing to act on this information should consult with a financial advisor. The article may contain “forward-looking statements” within the meaning of applicable securities legislation. Forward-looking statements are based on the opinions and assumptions of the Company’s management as of the date made. They are inherently susceptible to uncertainty and other factors that could cause actual events/results to differ materially from these forward-looking statements. Additional risks and uncertainties, including those that the Company does not know about now or that it currently deems immaterial, may also adversely affect the Company’s business or any investment therein. Any projections given are principally intended for use as objectives and are not intended, and should not be taken, as assurances that the projected results will be obtained by the Company. The assumptions used may not prove to be accurate and a potential decline in the Company’s financial condition or results of operations may negatively impact the value of its securities. Please read eResearch’s full disclaimer.