eResearch│We have created a portfolio of high-payout equities that is focused primarily on attractive dividend yields but with some capital growth potential. Our performance since Inception on June 1, 20021 has been exceptional.
NOTE: The Dividend Yield Portfolio is designed with a longer-term perspective. As such, we update it every month-end, usually using the final Friday’s or the actual month-end’s closing prices. Essentially, it is a Buy-and-Hold portfolio, with minimal trading involved. The Portfolio is appropriately invested but, if circumstances warrant, there could be a sizable cash component. The Portfolio was initiated on June 1, 2021 with ten stocks. The initial investment, at inception, was $500,000. The maximum dollar amount invested in any one position is capped at $50,000. Net profit gains from the sale of stocks/ETFs can be used to invest in new, but not existing, equity positions.
NOTE: We are now tracking the Dividend Yield Portfolio from two perspectives: (1) from June 1, 2021, when it was initiated; and (2) from January 1, 2022, to gain insight as to how the Portfolio has done on a calendar year basis.
MARKET COMMENT
One of the key factors in assessing the outlook for 2022 is anticipating the moves of the U.S. Federal Reserve. At its last meeting, the governors considered (a) increasing the federal funds rate, probably in March, and (b) lowering the Fed’s balance sheet liabilities.
The problem that lies ahead is how to deal with inflation, which has increased at a rate well in excess of initial expectations. The Fed has two official mandates and they are to maintain price stability and to maximize employment. The tricky part is balancing these two mandates.
If interest rates are raised too quickly, that would likely slow the growth in the economy which, in turn, would impact negatively on employment prospects. With current high inflation and a slowly recovering economy, it will be interesting to watch the Fed’s balancing act over the ensuing months.
TODAY’S PORTFOLIO COMMENT
The eResearch Dividend Yield Portfolio closed the month of December and the 2021 year at $554,478, representing a gain of 10.9% since Inception from the $500,000 initial investment.
January has proven to be a rough month for the market. For too long, we have been expecting a broad market pull-back. As we stated in our last month’s dissertation, we anticipate that 2022 will be “tough sledding for the markets.” See further comments on the Market below.
Our Dividend Yield Portfolio reached an all-time high on January 17, 2022, of $569,499. It ended the month at $563,434, which represents a gain of 12.7% since Inception on June 1, 2021, eight months ago. Extrapolating, that would be a gain of 19.0% on an annualized basis.
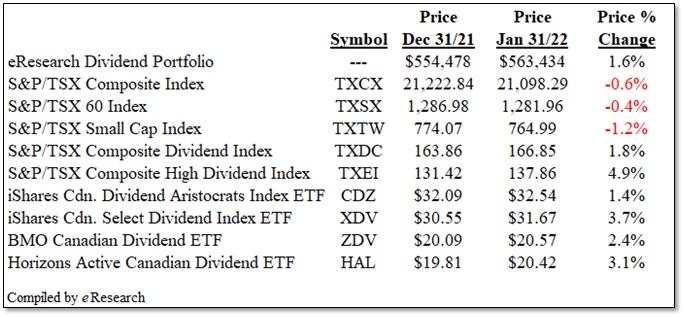
For January itself, our Portfolio was up 1.6%. This compares favourably with many market Indexes as exemplified in the following table.
Figure 1: January Performance Comparisons
There were no additions or deletions made to the Portfolio during the month of January. There were, however, two dividend increases. Canadian Utilities Limited (TSX: CU) raised its quarterly payment from $0.4398 per share to $0.4442 (1.0%) and Mullen Group Ltd. (TSX: MTL), which raised its monthly payment 25% from $0.04 to $0.05, as we highlighted in last month’s report.
MARKET COMMENT: We have commented that we expect 2022 to be a challenging year for the stock market after such a sterling performance in 2021 as global economies struggled to recover from pandemic lows.
We list below both positive and negative factors that could affect stock market performance in 2022. We found this information on a video on the TD Direct Investing website. (Source: Brad Simpson, Chief Wealth Strategist, TD Wealth Management)
Negative Considerations:
- Expensive valuations;
- Central bank tightening policy;
- Possibility of policy mistakes;
- Removal of quantitative easing;
- Escalating inflation;
- Rising interest rates;
- Continuing labour shortages;
- Continuing supply bottlenecks;
- Global growth slow-downs, particularly China;
- Geopolitical conflicts (Ukraine; Taiwan, Iran);
- Continuing pandemic, including possible new variants;
- Vaccine efficacy against variants; and
- Continuing lock-downs/shut-downs.
Positive Considerations:
- Robust economic growth;
- Strong credit considerations;
- Abundant liquidity;
- Strong investor risk appetite;
- Dividend increases;
- Buy-backs;
- Strong consumer demand;
- Lower risk of inflation as central banks tighten;
- Rising corporate earnings;
- Strong and rising corporate CAPEX;
- Low debt-servicing costs;
- Strong employment; and
- Lack of tax-payer tantrums.
ERESEARCH DIVIDEND YIELD PORTFOLIO: The eResearch Dividend Yield Portfolio, despite being highly defensive, has performed very well, and we expect it to continue doing so even if the market undergoes a general retreat.
Set out below is the eResearch Dividend Yield Portfolio, as of January 31, 2022.
CONSTITUENTS
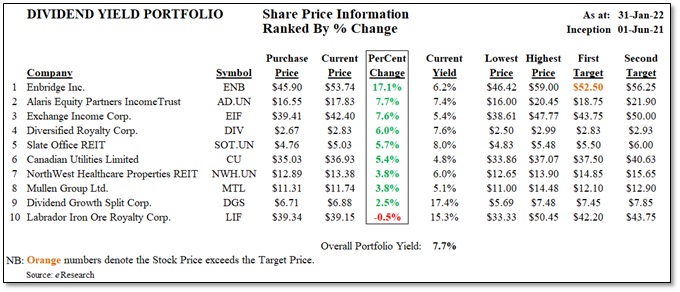
Figure 2: Dividend Yield Portfolio – Constituents
COMMENTS:
- Briefly, two trading days ago, our Portfolio had no “losers”. However, Labrador Iron Ore Royalty Corp. (TSX: LIF) returned to “underwater” status as the month closed out.
- Our income-oriented portfolio obviously emphasizes yield, as shown for the individual stock holdings. The Portfolio’s current yield is 7.7%. There is more information on dividends below.
PERFORMANCE
In this report, we are showing our Portfolio’s performance (1) from June 1, 2021, and (2) from January 1, 2022. We will continue to monitor the Portfolio’s performance from these two dates.
The Portfolio’s performance for the two time periods is provided in the following tables.
Figure 3: Dividend Yield Portfolio – Performance Since June 1, 2021
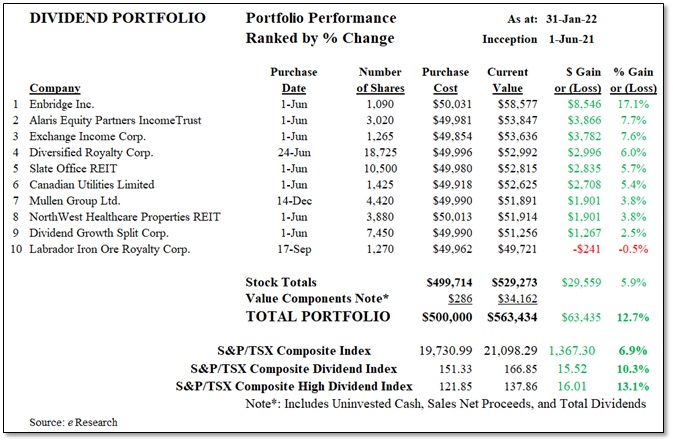
COMMENT: Eight months after Inception, Enbridge (TSX: ENB) has easily been our star performer. Labrador Iron Ore Royalty has been flirting with break-even for quite a while. As will be shown in the Dividends table below, Labrador is the second highest-yielding company in our Portfolio.
Figure 4: Dividend Yield Portfolio – Performance Since January 1, 2022
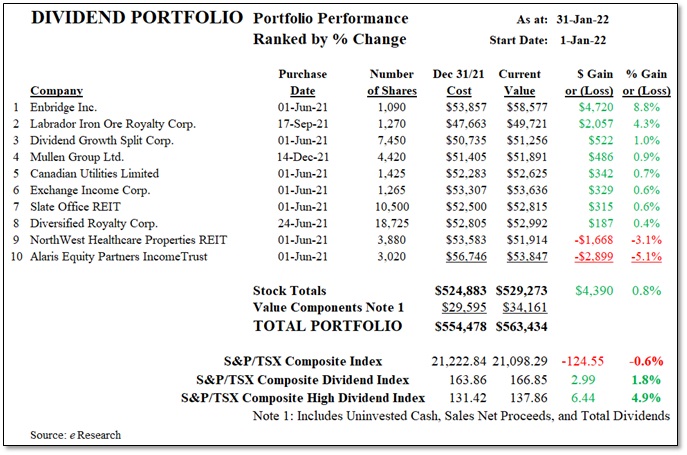
COMMENT: It is a different story when it comes to performance only in 2022. Only Enbridge is doing as well in 2022 as it has over the last eight months. Alaris Equity Partners (TSX: AD.UN) sits at the bottom in 2022 whereas it has consistently been in the top two since June 2021. Labrador Iron Ore Royalty has performed well since the beginning of the year.
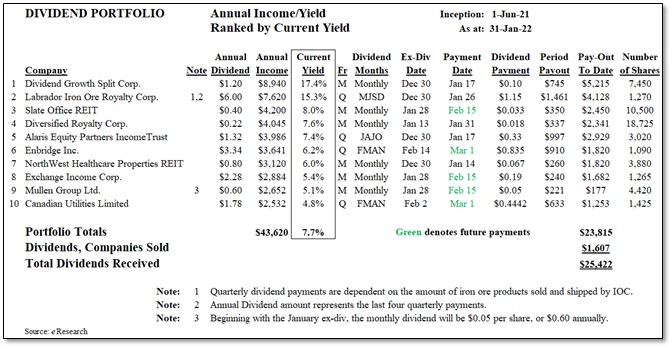
DIVIDEND INCOME/YIELD
Below, we provide a table that indicates the annual dividend, the corresponding annual income and current equity yields, and the dividend pay-outs to date since inception.
The Portfolio is currently yielding 7.7%.
Figure 5: Dividend Yield Portfolio – Income/Yield and Dividend Information
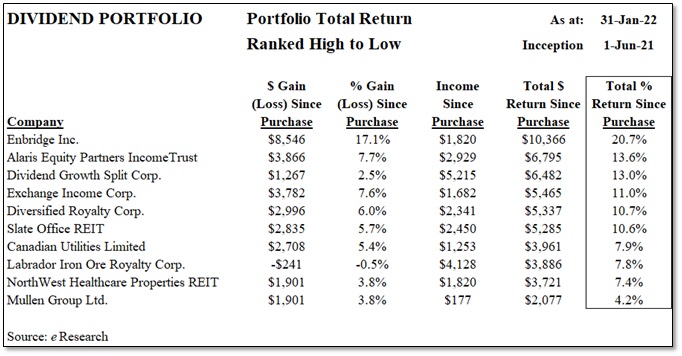
TOTAL RETURNS
The next table shows each stock holding’s capital gain/(loss), its income generated, and the total return in dollar and percentage terms.
Figure 6: Dividend Yield Portfolio – Total Return
COMPARABLES
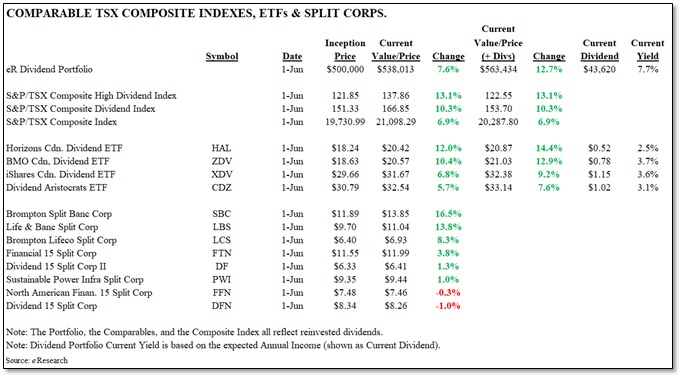
Since the Portfolio’s inception on June 1, 2021:
- the Portfolio is up 12.7%;
- the S&P/TSX Composite Index is ahead by 6.9%;
- the S&P/TSX Dividend Index is up 10.3% and the S&P/TSX High Dividend Index is ahead by 13.1%
- the ETFs range between 7.6% and 14.4%; and
- the Split Corps range between -1.0% and 16.5%.
All of these parameters, shown in Figure 7 below, have improved from a month ago.
The next table compares the performance of the Portfolio against these aforementioned benchmarks, namely (a) the S&P/TSX Composite Index, the S&P/TSX Composite Dividend Index, and the S&P/TSX Composite High Dividend Index, (b) four selected higher-yield ETFs, and (c) eight notable Split Corps.
Figure 7: Dividend Yield Portfolio – Comparatives
Graphical Performance
We also show, in the graph below, the performance of the Portfolio against the top four of these comparatives.
The eResearch Portfolio has reclaimed the top spot amongst its comparatives with a return of 10.9% (see the arrow in the graph below). Horizons Canadian Dividend ETF (TSX: HAL) has slipped back to second place with a gain of 10.2%. The other three comparatives comprising the top four are the S&P/TSX Dividend Index, up 8.3%, the S&P/TSX High Dividend Index, ahead by 7.9%, and the S&P/TSX Composite Index, with a return of 7.6%
Figure 8: Dividend Yield Portfolio – Graphical Comparison (Top Four Only)
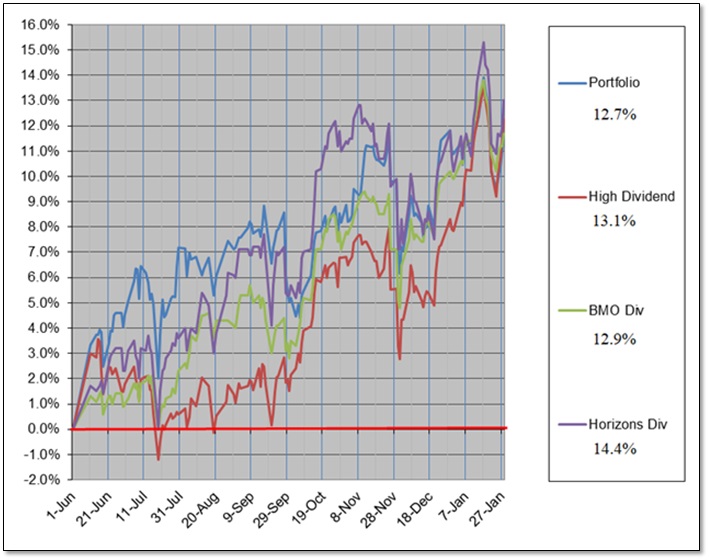
Figure 9: Dividend Yield Portfolio – Stocks Sold
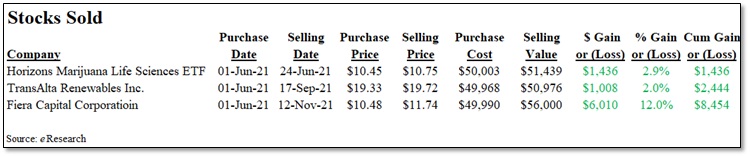
COMMENT: To date, we have sold three stocks from the Portfolio. Collectively, they have provided a cumulative Capital Gain of $8,454.
Notes: All numbers in CAD unless otherwise stated. The author of this report, and employees, consultants, and family of eResearch may own stock positions in companies mentioned in this article and may have been paid by a company mentioned in the article or research report. eResearch offers no representations or warranties that any of the information contained in this article is accurate or complete. Articles on eresearch.com are provided for general informational purposes only and do not constitute financial, investment, tax, legal, or accounting advice nor does it constitute an offer or solicitation to buy or sell any securities referred to. Individual circumstances and current events are critical to sound investment planning; anyone wishing to act on this information should consult with a financial advisor. The article may contain “forward-looking statements” within the meaning of applicable securities legislation. Forward-looking statements are based on the opinions and assumptions of the Company’s management as of the date made. They are inherently susceptible to uncertainty and other factors that could cause actual events/results to differ materially from these forward-looking statements. Additional risks and uncertainties, including those that the Company does not know about now or that it currently deems immaterial, may also adversely affect the Company’s business or any investment therein. Any projections given are principally intended for use as objectives and are not intended, and should not be taken, as assurances that the projected results will be obtained by the Company. The assumptions used may not prove to be accurate and a potential decline in the Company’s financial condition or results of operations may negatively impact the value of its securities. Please read eResearch’s full disclaimer.