eResearch│ We have created a portfolio of high-payout common stocks that is focused primarily on attractive dividend yields but with some capital growth potential.
NOTE: The Top-Ten Dividend Yield Portfolio is designed with a longer-term perspective. As such, we update it every month, using the final Friday’s closing prices. Essentially, it will be a Buy-and-Hold portfolio, with minimal trading involved. The Portfolio will be appropriately invested but, if circumstances warrant, there could be a sizable cash component. The Portfolio was initiated on June 1, 2021 with ten stocks. The initial investment, at inception, was $500,000.
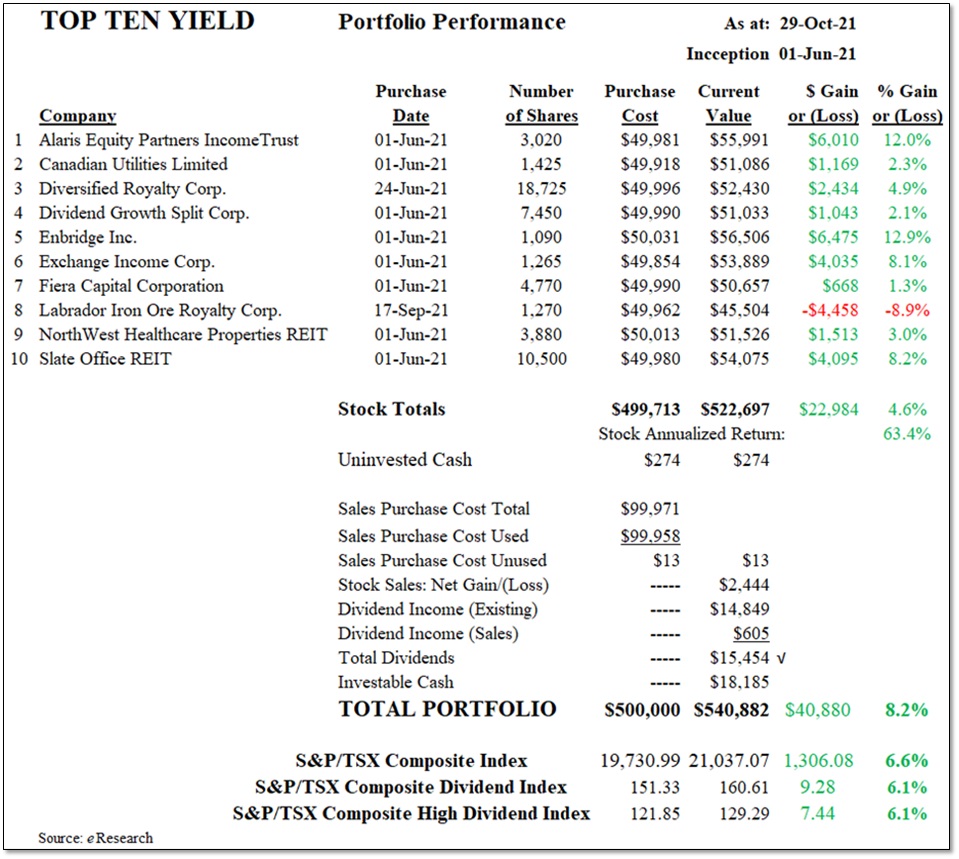
TODAY’S PORTFOLIO COMMENT: The value of the Portfolio at October 29, 2021 was $540,882, up 3.0% for the month, and up 8.2% from the $500,000 initial investment. For comparative purposes, the S&P/TSX Composite Index rose 4.9% during October, and is ahead 6.6% since the Portfolio’s inception on June 1, 2021.
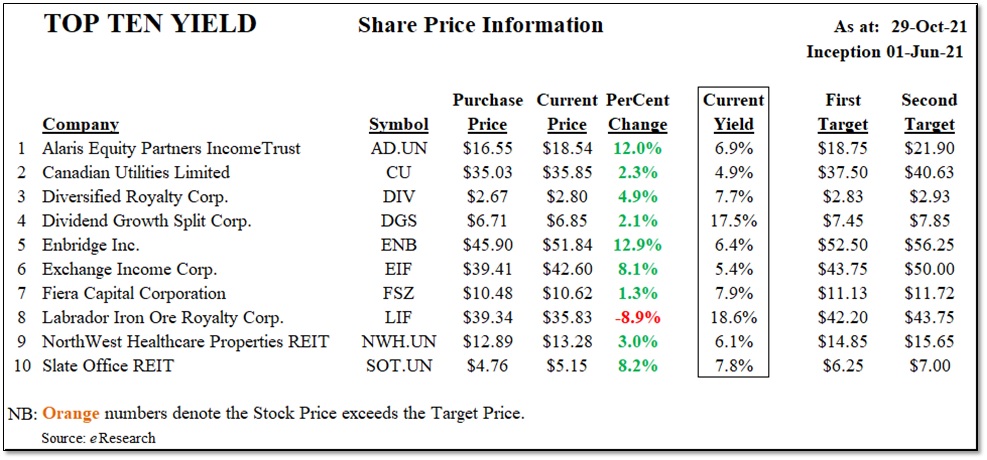
There were no changes made to the Portfolio during the month of October. At the end of the month, there was just one stock that was in the RED, and that is Labrador Iron Ore Royalty Corporation (TSX: LIF). It was up 1.7% on the month, but is down 8.9% since purchase. However, its indicated dividend yield (based on the last four quarterly pay-outs), is currently 18.6%!
MARKET COMMENT: This month we have to eat, yet again, the proverbial “crow”. If anyone says that they totally understand this market, they should be committed. This market defies historical logic. But one of the common adages of the market is to “Let your winners run, and cut your losses”.
So, here we are with the S&P 500 Index sitting at its all-time high, at 4,600. The Dow Jones Industrial Index is at its all-time high, just under 36,000. The NASDAQ is not to be out-done; it is at its all-time high at 15,500. Also last week, the S&P/TSX Composite Index reached its all-time high of 21,300.
Where is this pull-back I keep mentioning every month? In addition, we are now, historically, entering the market’s strongest performance period, from late October until mid-May. That is not to say that the market will continue to churn ever higher. There are increasing disquieting signs that, so far, the market is completely ignoring. Sure hope this dog does not turn around and bite us. A gentle muzzle is much preferred.
Set out below is the eResearch Dividend Yield Portfolio, as at October 29, 2021:
Figure 1: Top Ten Dividend Portfolio – Constituents
COMMENT: The Portfolio has just one stock that is “under water”, that being Labrador Iron Ore Royalty Corporation. This is an income-oriented portfolio so the emphasis is on yield, as shown. Fortunately, our capital gain performance has greatly enhanced our overall return, now 8.2% as indicated in Figure 2 below.
The Portfolio’s performance is provided in the following table.
Figure 2: Top Ten Dividend Portfolio – Performance
COMPARABLES
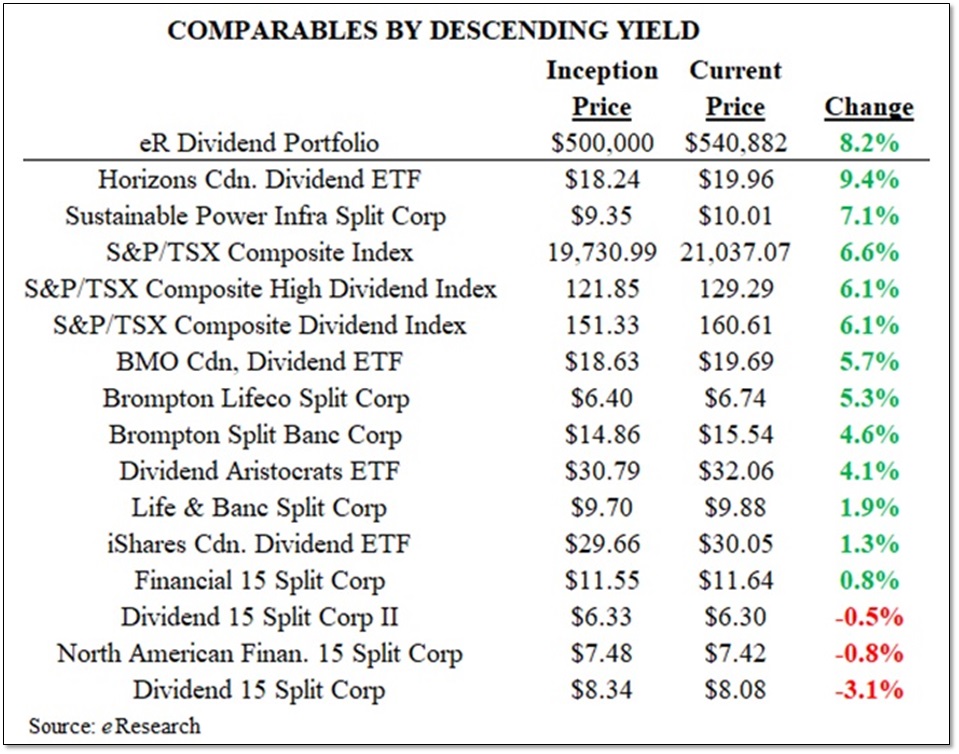
Since the Portfolio’s inception on June 1, 2021:
- the Portfolio is up 8.2%;
- the S&P/TSX Composite Index is ahead by 6.6%;
- the S&P/TSX Dividend Index is up 6.1% and the S&P/TSX High Dividend Index too is ahead by 6.1%
- the ETFs range between 1.3% and 9.4%; and
- the Split Corps range between -3.1% and 7.1%.
In the next table, we compare the performance of the Portfolio against (a) the S&P/TSX Composite Index, the S&P/TSX Composite Dividend Index, and the S&P/TSX Composite High Dividend Index, (b) four selected higher-yield ETFs, and (c) eight notable Split Corps.
Figure 3: Top Ten Dividend Portfolio – Comparatives
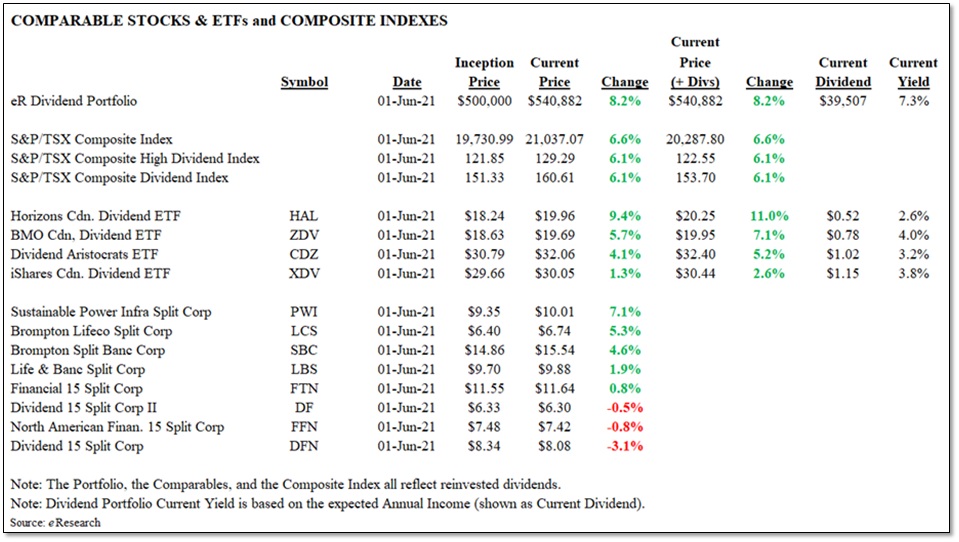
Figure 4: Top Ten Dividend Portfolio – Comparatives Gains
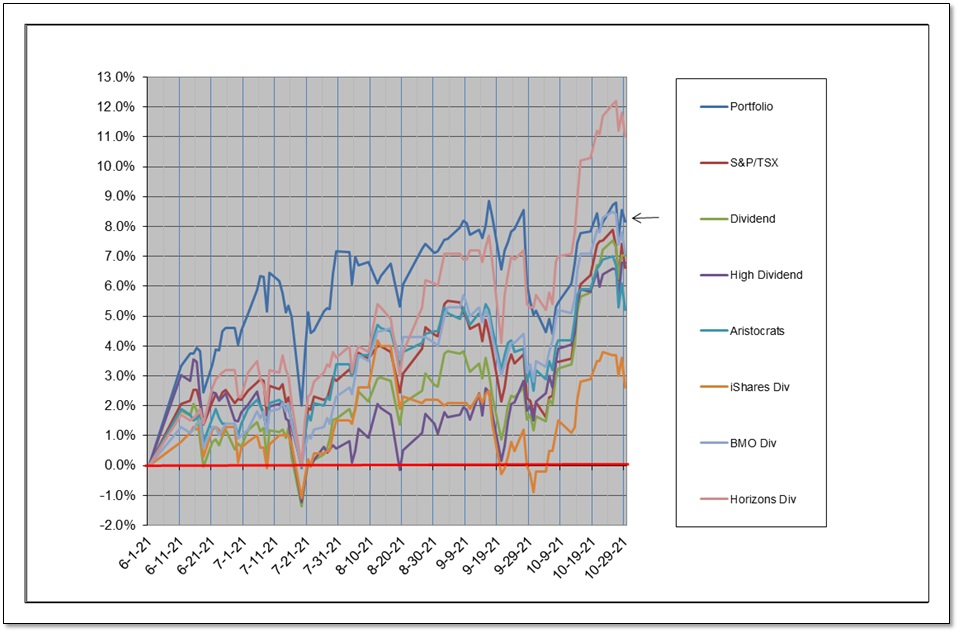
We also show below the performance of the Portfolio against the respective ETFs and Indexes both in a table and then in graphical form.
Until very recently, the eResearch Portfolio, currently up 8.2%, was consistently the best performer in the comparison. Now the Horizons Canadian Dividend ETF (TSX: HAL), up 11.0%, sports the highest return.
Figure 5: Top Ten Dividend Portfolio – Tabular Comparison
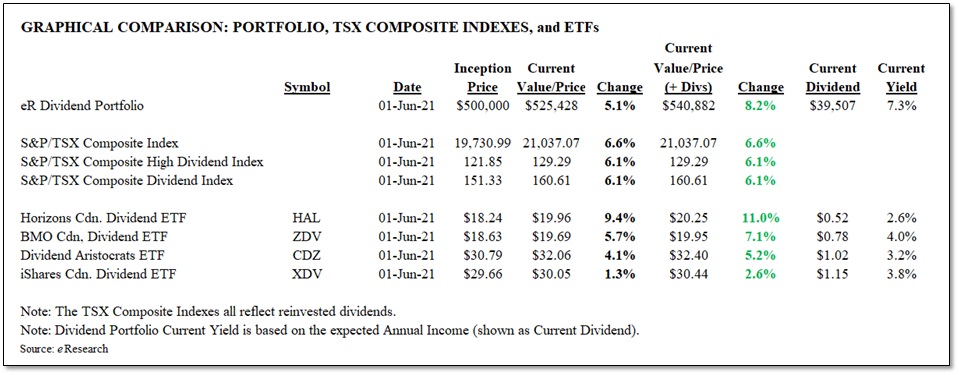
Figure 6: Top Ten Dividend Portfolio – Graphical Comparison
DIVIDEND INCOME/YIELD
Below, we provide a table that indicates the annual dividend, the corresponding annual income and current equity yields, and the dividend pay-outs to date since inception.
The Portfolio is currently yielding 7.3%.
Figure 7: Top Ten Dividend Portfolio – Income/Yield
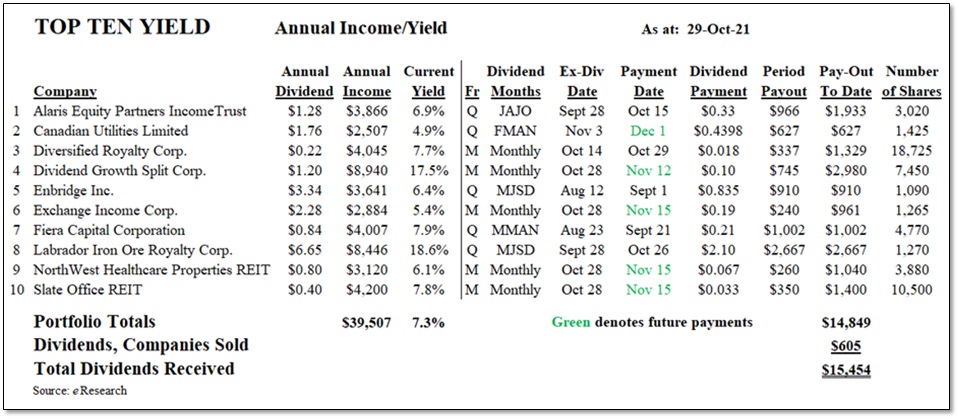
Figure 8: Top Ten Dividend Portfolio – Stocks Sold
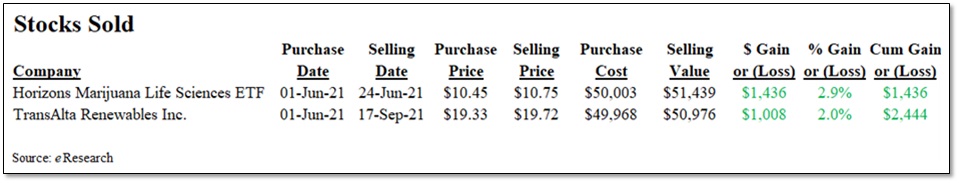
COMMENT: To date, we have sold only two stocks from the Portfolio. Collectively, they have provided a cumulative Capital Gain of $2,444.
Notes: All numbers in CAD unless otherwise stated. The author of this report, and employees, consultants, and families of eResearch personnel may own stock positions in companies mentioned in this article and may have been paid by a company mentioned in the article or research report. eResearch offers no representations or warranties that any of the information contained in this article is accurate or complete. Articles on eresearch.com are provided for general informational purposes only and do not constitute financial, investment, tax, legal, or accounting advice nor does it constitute an offer or solicitation to buy or sell any securities referred to. Individual circumstances and current events are critical to sound investment planning; anyone wishing to act on this information should consult with a financial advisor. The article may contain “forward-looking statements” within the meaning of applicable securities legislation. Forward-looking statements are based on the opinions and assumptions of the Company’s management as of the date made. They are inherently susceptible to uncertainty and other factors that could cause actual events/results to differ materially from these forward-looking statements. Additional risks and uncertainties, including those that the Company does not know about now or that it currently deems immaterial, may also adversely affect the Company’s business or any investment therein. Any projections given are principally intended for use as objectives and are not intended, and should not be taken, as assurances that the projected results will be obtained by the Company. The assumptions used may not prove to be accurate and a potential decline in the Company’s financial condition or results of operations may negatively impact the value of its securities. Please read eResearch’s full disclaimer.