eResearch | There are always exceptions to the rule. Historically, the market enters its strong seasonal period from late October until about mid-May. December benefits from the Santa Claus Rally. January represents a “rebirth”, a “new start” with optimism and high expectations. But extraneous factors can upset the “apple cart”. Despite the market’s strong seasonality right now, after such a sustained up-move since March 2020, it really is time for a meaningful pause and pull-back. Has it started?
The financial website pages have been screaming all November. To wit …
- “Risks of a market bubble are growing,” warns Morgan Stanley November 8
- “The stock market might soon be faced with the reality that it can’t keep talking to itself”, MarketWatch November 13
- “Here’s how to decide whether the S&P 500 is now heading toward a correction”, MarketWatch November 13
- Morgan Stanley is out with its 2022 market outlook, and it sees a decline, MarketWatch, November 15
- Record selling by insiders is setting up stocks for a big fall, says contrarian investor, MarketWatch, November 18
For some time, we have cautioned that the market was due for a pull-back. As is often the case, the correction comes right out of the blue. We are not convinced that the pull-back so far will turn into a meaningful drop in the market indexes. For us, a meaningful pull-back or correction in an index is a decline of 10%-15% from its high. Over 15% and we have a market rout. After such an extended up-move this year, a pull-back was/is badly needed. Let us have a look at the performance of two indexes in 2021, the S&P 500 Index and the S&P/TSX Composite Index. First, the S&P 500.
Figure 1: S&P 500 Index 2021 To Date (November 30)
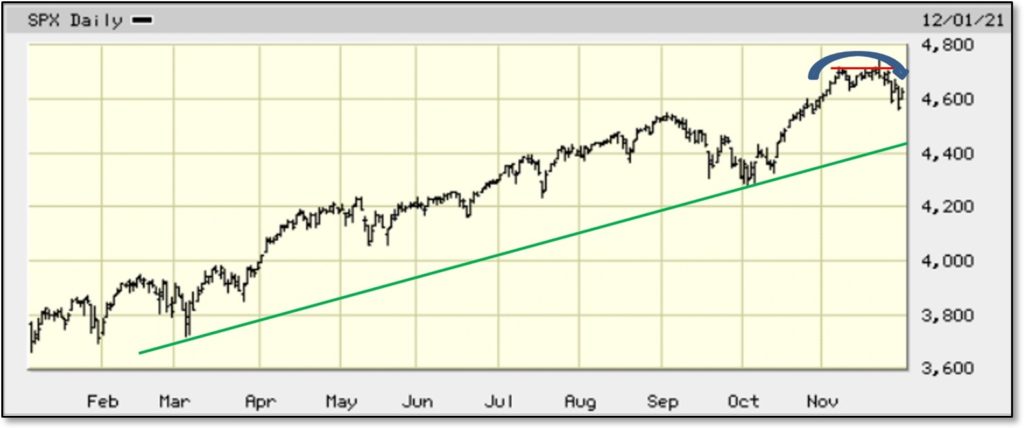
Source: www.bigcharts.comCOMMENT: This year’s Green up-trend line is still intact. In fact, it started in March 2020 after the Big Collapse. The up-trend line is not breached until the Index falls to about 4,440, which is 6.4% below the end of November close. That is not that far a drop. The Index looks like it is rolling over (Blue arc), and it put in a Double Top (Red horizontal line). But, roll-overs are not uncommon: look at mid-February; end of April; and end of August. If a down-draft occurs, look for Support at 4,300 and 4,200, then 4,000.
Next up, the S&P/TSX Composite Index.
Figure 2: S&P/TSX Composite Index 2021 To Date (November 30)
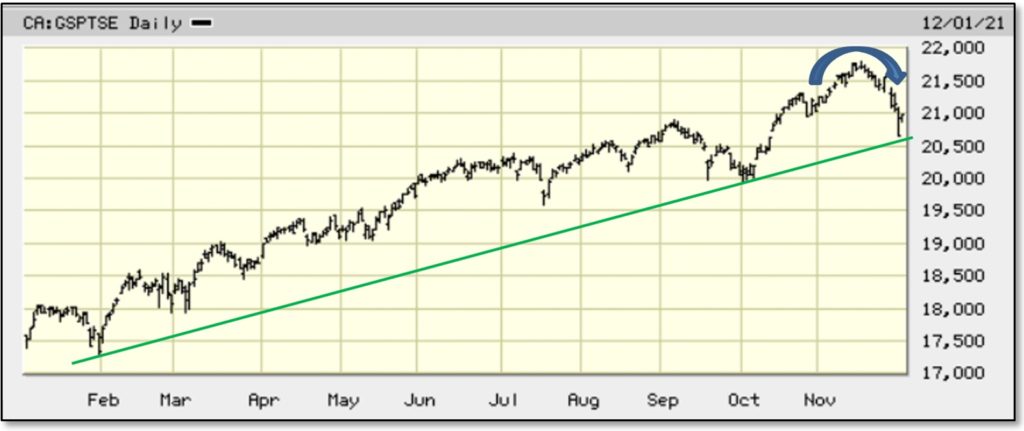
Comment: Not surprisingly, the Canadian Index looks quite similar to its American cousin. However, the distance to the Green up-trend line is quite short, so a breach could occur at any time. The TSX Index shows the same roll-over pattern (Blue arc) as the S&P 500. There is strong Support at the nice round 20,000 level, then at 19,500.
Changes For December
There are FOUR market indexes/sectors that exhibit new seasonal strength in December. These consist of only commodity sectors: Gold, Silver, Copper, and Crude Oil Futures. See the chart below.
The THIRTY-ONE indexes/sectors that leave their period of seasonality strength behind this month are too numerous to list, but they are all shown in the chart below.
There were TWO sectors that left during the month of November: the U.S. Dollar Index and the Airlines.
Seasonal Trends for the Market Segments in December
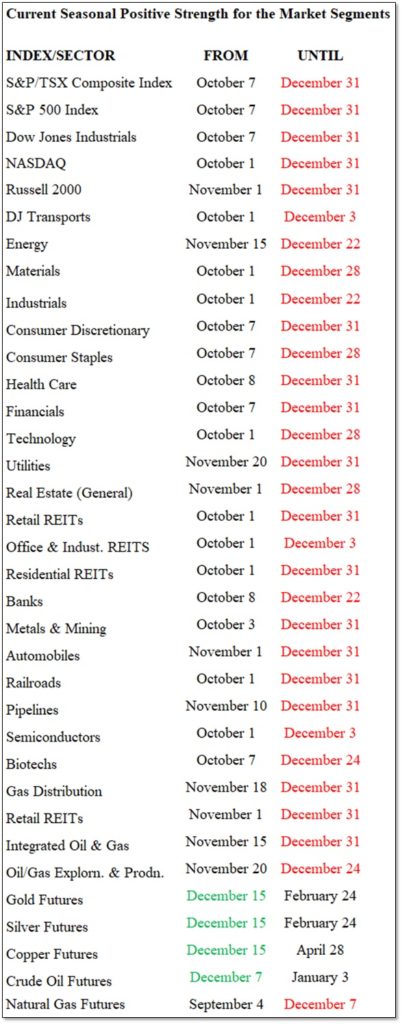
The following table shows which indexes/sectors gain or lose seasonal strength during the month of December. There are 4 additions this month, shown in GREEN under FROM, and there are 31 expiries this month, shown in RED under UNTIL
NOTE: A full seasonality list of indexes and sectors is provided at the end of this report.
Figure 3: Current Seasonal Positive Strength for the Market Segments
Importance Of Seasonality Trends
Seasonality refers to particular time-frames when stocks/sectors/indexes are subjected to and influenced by recurring tendencies that produce patterns that are apparent in the investment valuation process. A seasonality study preferably uses at least 10 years of data.
Seasonality Trends Chart
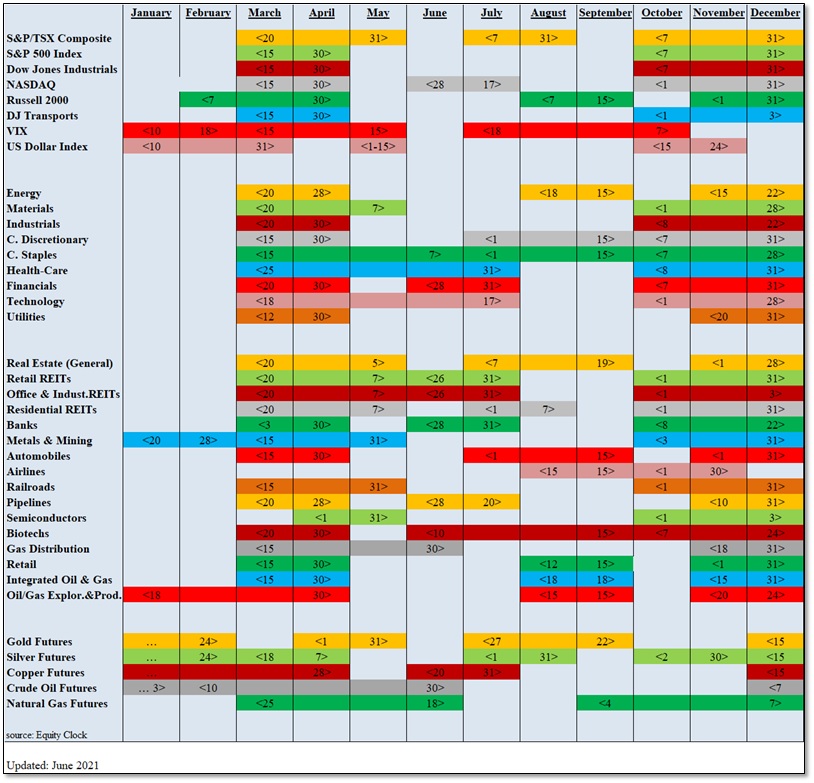
The Seasonality Trends chart below was updated in June 2021. The chart shows the periods of seasonal strength for 38 (formerly 28) market segments (sectors/indexes). Each bar indicates a buy and a sell date based upon the optimal holding period for each market sector/index.
The ten new industry sectors are (1) Retail REITs, (2) Office & Industrial REITs, (3) Residential REITs, (4) Pipelines, (5) Semiconductors, (6) Integrated Oil & Gas, (7) Crude Oil Futures, (8) Automobiles, (9) Airlines, and (10) Railroads.
The Seasonality trends chart is an ever-changing 14-year average of the indexes and sub-indexes that we track. The information in the chart is courtesy of www.equityclock.com.
Figure 4: Seasonality Trends Chart
Notes: All numbers in CAD unless otherwise stated. The author of this report, and employees, consultants, and family of eResearch may own stock positions in companies mentioned in this article and may have been paid by a company mentioned in the article or research report. eResearch offers no representations or warranties that any of the information contained in this article is accurate or complete. Articles on eresearch.com are provided for general informational purposes only and do not constitute financial, investment, tax, legal, or accounting advice nor does it constitute an offer or solicitation to buy or sell any securities referred to. Individual circumstances and current events are critical to sound investment planning; anyone wishing to act on this information should consult with a financial advisor. The article may contain “forward-looking statements” within the meaning of applicable securities legislation. Forward-looking statements are based on the opinions and assumptions of the Company’s management as of the date made. They are inherently susceptible to uncertainty and other factors that could cause actual events/results to differ materially from these forward-looking statements. Additional risks and uncertainties, including those that the Company does not know about now or that it currently deems immaterial, may also adversely affect the Company’s business or any investment therein. Any projections given are principally intended for use as objectives and are not intended, and should not be taken, as assurances that the projected results will be obtained by the Company. The assumptions used may not prove to be accurate and a potential decline in the Company’s financial condition or results of operations may negatively impact the value of its securities. Please read eResearch’s full disclaimer.
