eResearch│We have created a portfolio of high-payout equities that is focused primarily on attractive dividend yields but with some capital growth potential. Our performance since Inception on June 1, 20021 has been exceptional.
NOTE: The Dividend Yield Portfolio is designed with a longer-term perspective. As such, we update it every month-end, usually using the final Friday’s or the actual month-end’s closing prices. Essentially, it is a Buy-and-Hold portfolio, with minimal trading involved. The Portfolio is appropriately invested but, if circumstances warrant, there could be a sizable cash component. The Portfolio was initiated on June 1, 2021 with ten stocks. The initial investment, at inception, was $500,000. The maximum dollar amount invested in any one position is capped at $50,000. Net profit gains from the sale of stocks/ETFs can be used to invest in new, but not existing, equity positions.
NOTE: We are now tracking the Dividend Yield Portfolio from two perspectives: (1) from June 1, 2021, when it was initiated; and (2) from January 1, 2022, to gain insight as to how the Portfolio is doing on a calendar year basis.
TODAY’S PORTFOLIO COMMENT: The eResearch Dividend Yield Portfolio closed the month of December and the 2021 year at $554,478, representing a gain of 10.9% since the June 1, 2021 Inception from the $500,000 initial investment.
January and February have been difficult months for the market, with greatly increased volatility stemming from the Russian attack on Ukraine. We have been expecting a broad market pull-back for some time, but the recent heightened world tension has very broadly affected short-term stock market performance, and this volatility is likely to continue.
Figure 1 shows the performance of our Portfolio against selected Canadian and U.S. market Indexes.
Figure 1: February Performance Comparisons with Indexes
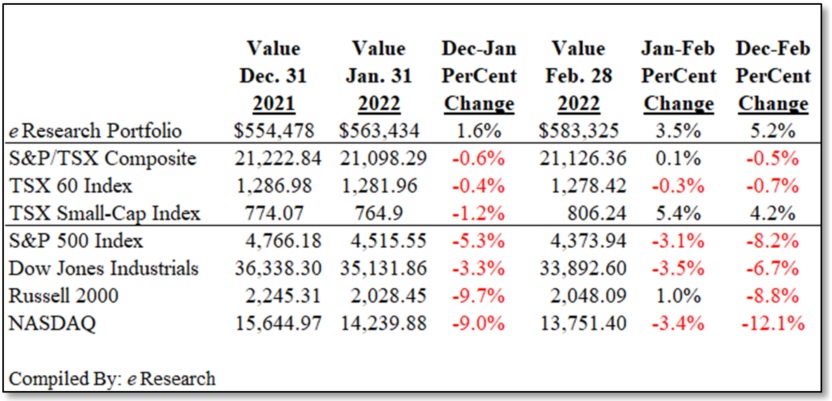
For 2022 to date, the eResearch Dividend Yield Portfolio has out-performed all of the selected Canadian and U.S. market indexes, with a gain of 5.2%. Only the TSX Small-Cap Index is in positive territory this year. All of the other indexes are showing losses.
Figure 2 shows the performance of our Portfolio against selected Canadian ETFs.
Figure 2: February Performance Comparisons with Canadian ETFs
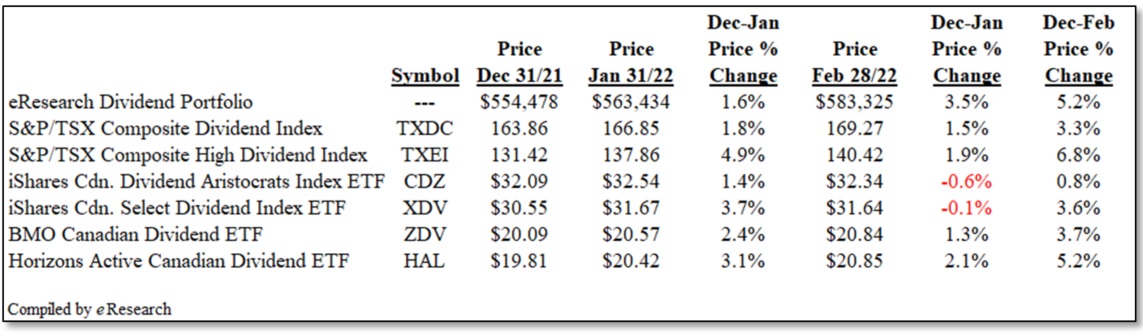
Again, for 2022 to date, our Portfolio compares favourably with the selected ETFs. Only the S&P/TSX High Dividend Index has done better. Horizons Active Canadian Dividend ETF has equaled our Portfolio’s performance.
Our Dividend Yield Portfolio reached an all-time high on February 16, 2022, of $585,064. It ended the month just slightly lower at $583,325, which represents a gain of 16.7% since Inception on June 1, 2021, nine months ago. Extrapolating, that would be a gain of 22.3% on an annualized basis.
For February itself, our Portfolio was up 3.5%. For the first two months of 2022, our Portfolio is ahead by 5.2%. In both instances, our Portfolio’s performance compares favourably with both market Indexes and selected Canadian ETFs as shown in the previous two tables.
There were no additions or deletions made to the Portfolio during the month of February.
MARKET COMMENT
The highly anticipated Russian attack on Ukraine finally occurred. Initially, the stock market recoiled at Putin’s barbaric decision. Despite the horror that has unfolded, the market showed its resiliency. Likewise did our Dividend Yield Portfolio. The good and surprising performance by the market likely reflects the probability that the Russian invasion has deferred any decision by Central Bankers to raise interest rates in the near term. It could also mean that the Central Bankers might have to continue with economic stimulus. At this point, no one knows how this situation is going to play out and what will be done to combat it and minimize its effects, on Ukraine, Russia, Europe, and North America, if not the entire world.
ERESEARCH DIVIDEND YIELD PORTFOLIO: The eResearch Dividend Yield Portfolio, despite being highly defensive, has performed very well, and we expect it to continue doing so even if the market undergoes a general retreat.
PERFORMANCE
In this report, we are showing our Portfolio’s performance (1) from June 1, 2021, and (2) from January 1, 2022. We will continue to monitor the Portfolio’s performance from these two dates.
The Portfolio’s performance for the two time periods is provided in the following tables.
Figure 3: Dividend Yield Portfolio – Performance Since June 1, 2021
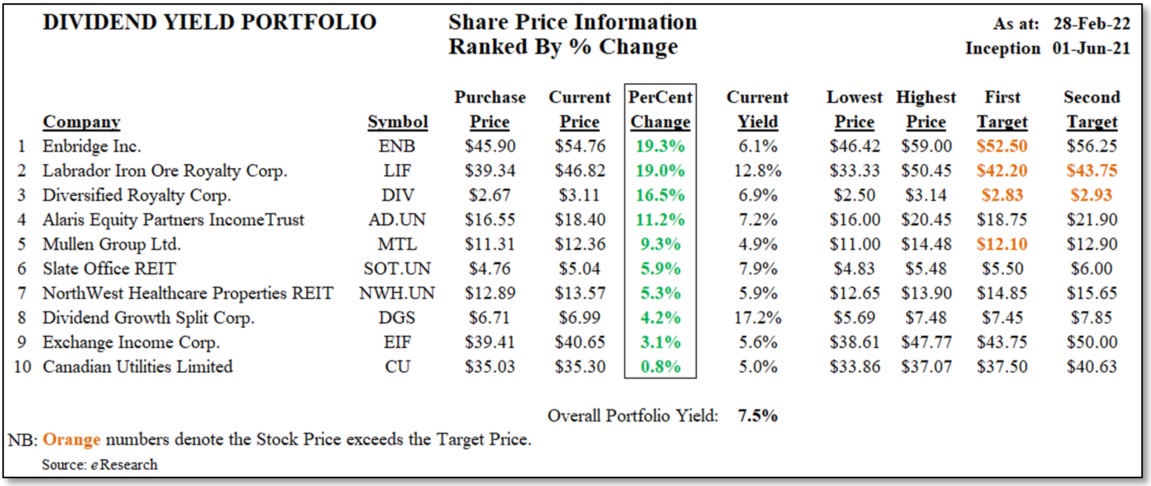
COMMENT: Our income-oriented portfolio obviously emphasizes yield, as shown for the individual stock holdings. The Portfolio’s current yield is 7.5%. There is more information on dividends below.
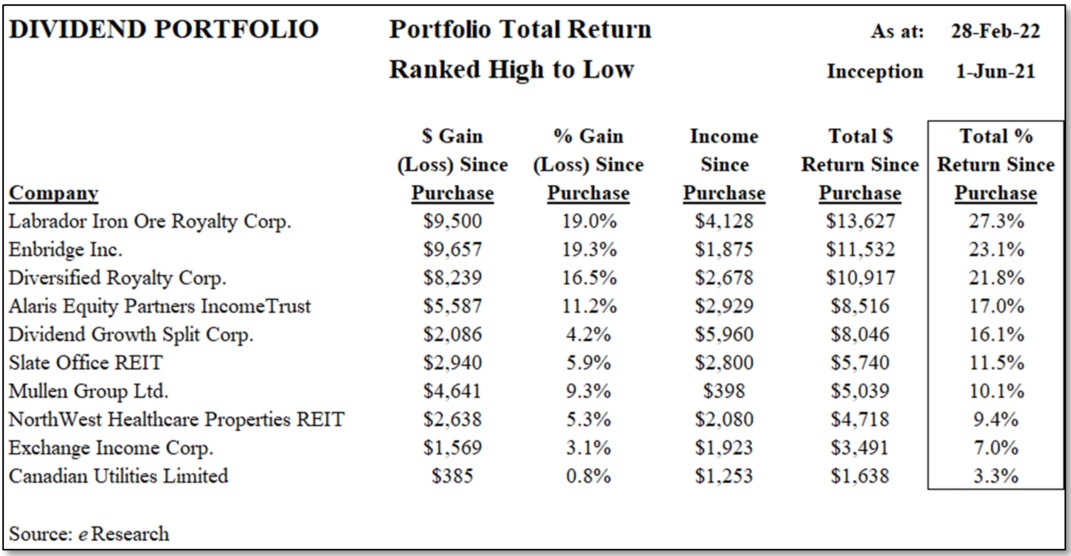
COMMENT: Since Inception on June 1, 2021, or from the Purchase Date for stocks bought after the Inception Date, Enbridge (TSX: ENB) has easily been our best performer. It is up 19.3%. At the end of February, our Portfolio had no “losers” since June 1, 2021, or from the Purchase Date if it is different from June 1, 2021. Labrador Iron Ore Royalty Corp. (TSX: LIF) was the star performer during February with a gain of 19.6%. It is up 19.0% since purchase last September. Canadian Utilities Limited (TSX: CU) was the biggest loser in February with a loss of 4.4%. But, since Inception, it is up 0.8%.
Figure 4: Dividend Yield Portfolio – Performance Since January 1, 2022
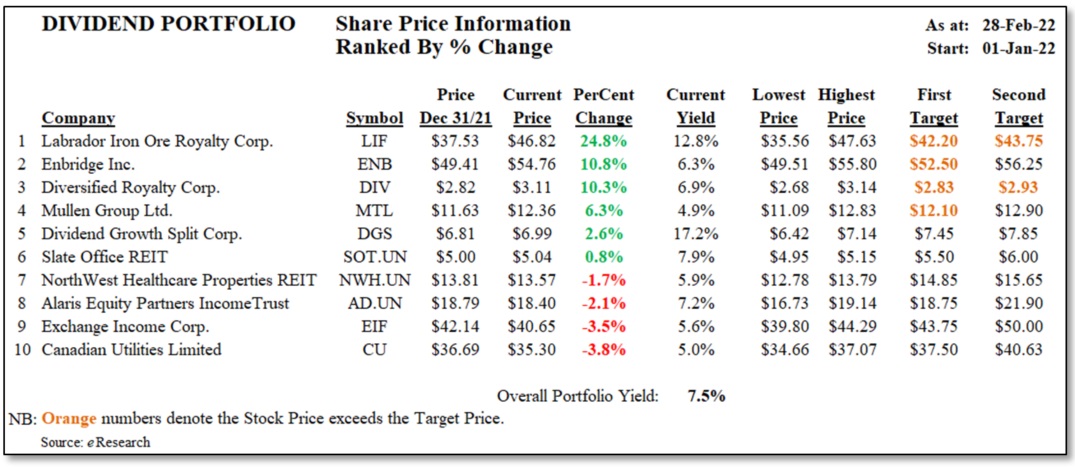
COMMENT: Since the beginning of 2022, Labrador Iron Ore Royalty has easily out-performed all of the other stocks in our Portfolio, garnering a gain of 24.8%. Enbridge comes next with a gain of 10.8%. There are four stocks that are below their start-of-year prices.
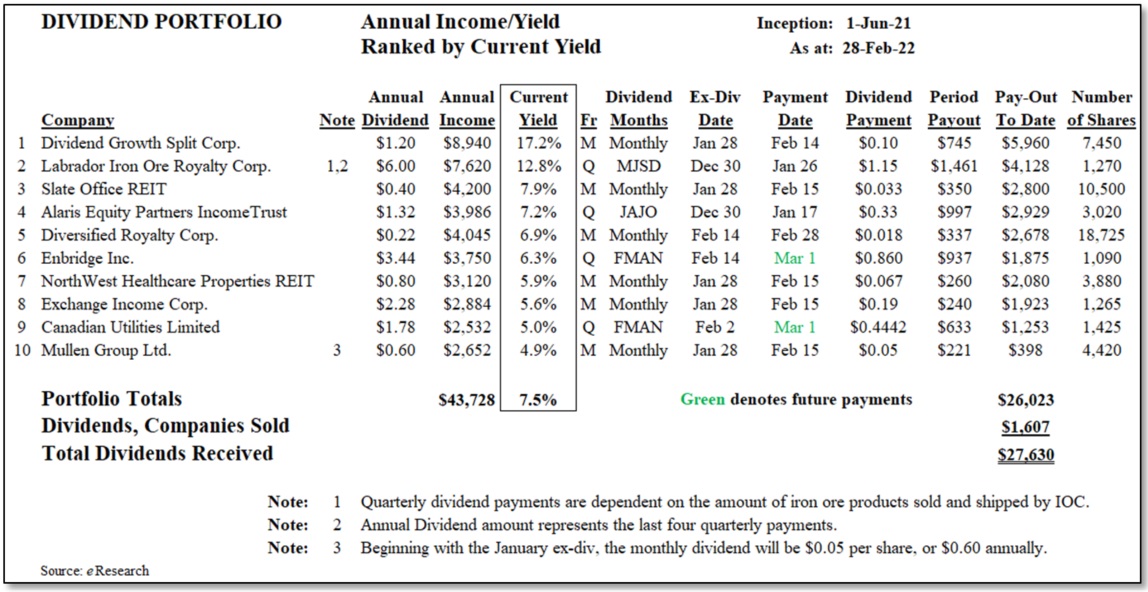
DIVIDEND INCOME/YIELD
Below, we provide a table that indicates the annual dividend, the corresponding annual income and current equity yields, and the dividend pay-outs to date since inception.
The Portfolio is currently yielding 7.5%.
Figure 5: Dividend Yield Portfolio – Income/Yield and Dividend Information
TOTAL RETURNS
The next table shows each stock holding’s capital gain/(loss), its income generated, and the total return in dollar and percentage terms.
Figure 6: Dividend Yield Portfolio – Total Return
COMPARABLES
Since the Portfolio’s inception on June 1, 2021:
- the Portfolio is up 16.7%;
- the S&P/TSX Composite Index is ahead by 7.1%;
- the S&P/TSX Dividend Index is up 11.9% and the S&P/TSX High Dividend Index is ahead by 15.2%
- the ETFs range between 7.3% and 18.2%; and
- the Split Corps range between -2.4% and 14.0%.
The next table shows the performance of the Portfolio against these aforementioned benchmarks, namely (a) the S&P/TSX Composite Index, the S&P/TSX Composite Dividend Index, and the S&P/TSX Composite High Dividend Index, (b) four selected higher-yield ETFs, and (c) eight notable Split Corps.
Only the Horizons Active Canadian Dividend ETF, with a gain of 18.2%, has out-performed our Portfolio’s gain of 16.7% since last June.
Figure 7: Dividend Yield Portfolio – Comparatives
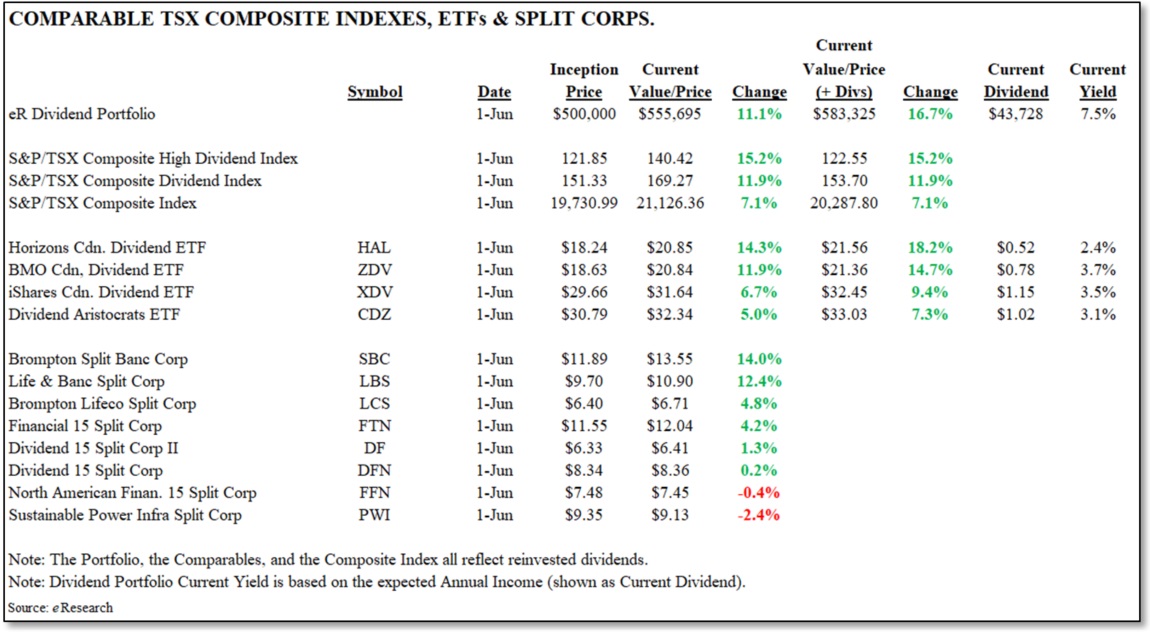
Figure 8: Dividend Yield Portfolio – Stocks Sold
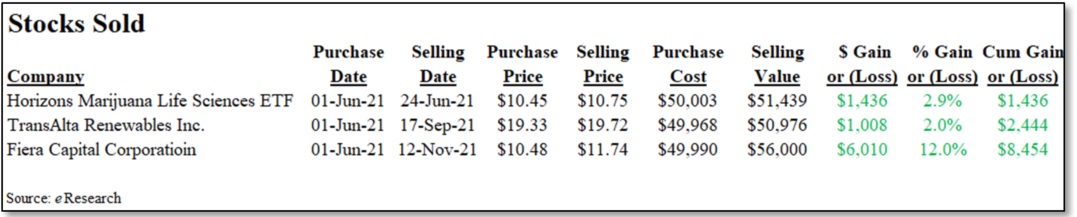
COMMENT: To date, we have sold three stocks from the Portfolio. Collectively, they have provided a cumulative Capital Gain of $8,454. For interest, the closing prices of these three stocks on February 28, 2022, were as follows: Horizons Marijuana Life Sciences $5.31; TransAlta Renewables $17.73; and Fiera Capital Corporation $10.49.
Notes: All numbers in CAD unless otherwise stated. The author of this report, and employees, consultants, and family of eResearch may own stock positions in companies mentioned in this article and may have been paid by a company mentioned in the article or research report. eResearch offers no representations or warranties that any of the information contained in this article is accurate or complete. Articles on eresearch.com are provided for general informational purposes only and do not constitute financial, investment, tax, legal, or accounting advice nor does it constitute an offer or solicitation to buy or sell any securities referred to. Individual circumstances and current events are critical to sound investment planning; anyone wishing to act on this information should consult with a financial advisor. The article may contain “forward-looking statements” within the meaning of applicable securities legislation. Forward-looking statements are based on the opinions and assumptions of the Company’s management as of the date made. They are inherently susceptible to uncertainty and other factors that could cause actual events/results to differ materially from these forward-looking statements. Additional risks and uncertainties, including those that the Company does not know about now or that it currently deems immaterial, may also adversely affect the Company’s business or any investment therein. Any projections given are principally intended for use as objectives and are not intended, and should not be taken, as assurances that the projected results will be obtained by the Company. The assumptions used may not prove to be accurate and a potential decline in the Company’s financial condition or results of operations may negatively impact the value of its securities. Please read eResearch’s full disclaimer.