eResearch | We track 12 Canadian sector ETFs and 12 U.S. sector ETFs and, eventually, we intend to publish monthly reports on the performance of these ETFs. From our research to date, we note that many of these ETFs have stumbled badly in the first two months of 2022.
On the Canadian exchange, five of the sectors are showing positive returns between 2.2% (Financials) and 27.8% (Energy), and seven sectors are in negative territory between -2.4% (Utilities) and -20.6% (Technology). On the major U.S. exchange, three sectors are positive between 4.3% (Global Gold) and 27.2% (Energy), and nine sectors are negative between -1.4% (Financials) and -13.2% (Consumers Discretionary).
Figure 1 shows the top three best and worst-performing ETFs on the respective Canadian and U.S. exchanges. For comparison, we include the major Canadian and U.S. market indexes.
Figure 1: Percentage Changes January 1, 2022 – February 28, 2022
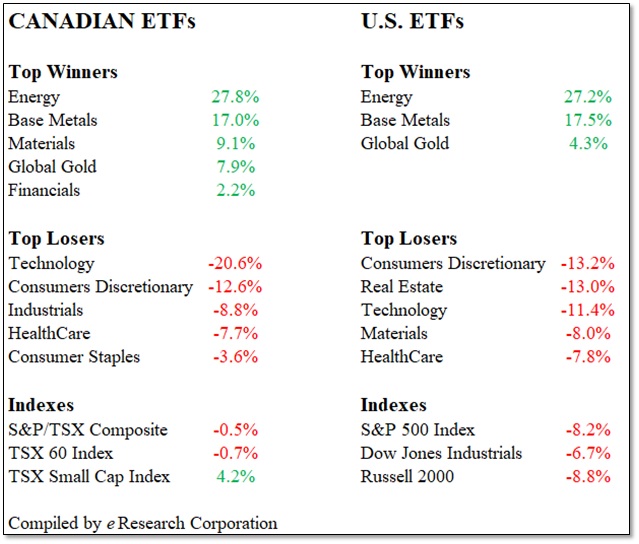
Observations: In both Canada and the USA, Energy has been the star performer, up more than 27% in just two months. Technology and Consumers Discretionary were both in the top three worst-performing sectors in Canada and the USA so far this year. Real Estate is the surprising loser in the USA, down 13.0%. In Canada, Real Estate is down only 3.5%.
We have been calling for a market pull-back for some time. Based on the first two months of the year, we may well indeed be experiencing the projected pull-back, particularly in the USA. To date, as shown in the table above, the S&P/TSX Composite Index and the TSX 60 Index are down 0.5% and 0.7% respectively. In the USA, the S&P 500 Index is off 8.2% and the DJIA is down 6.7%.
Changes for March
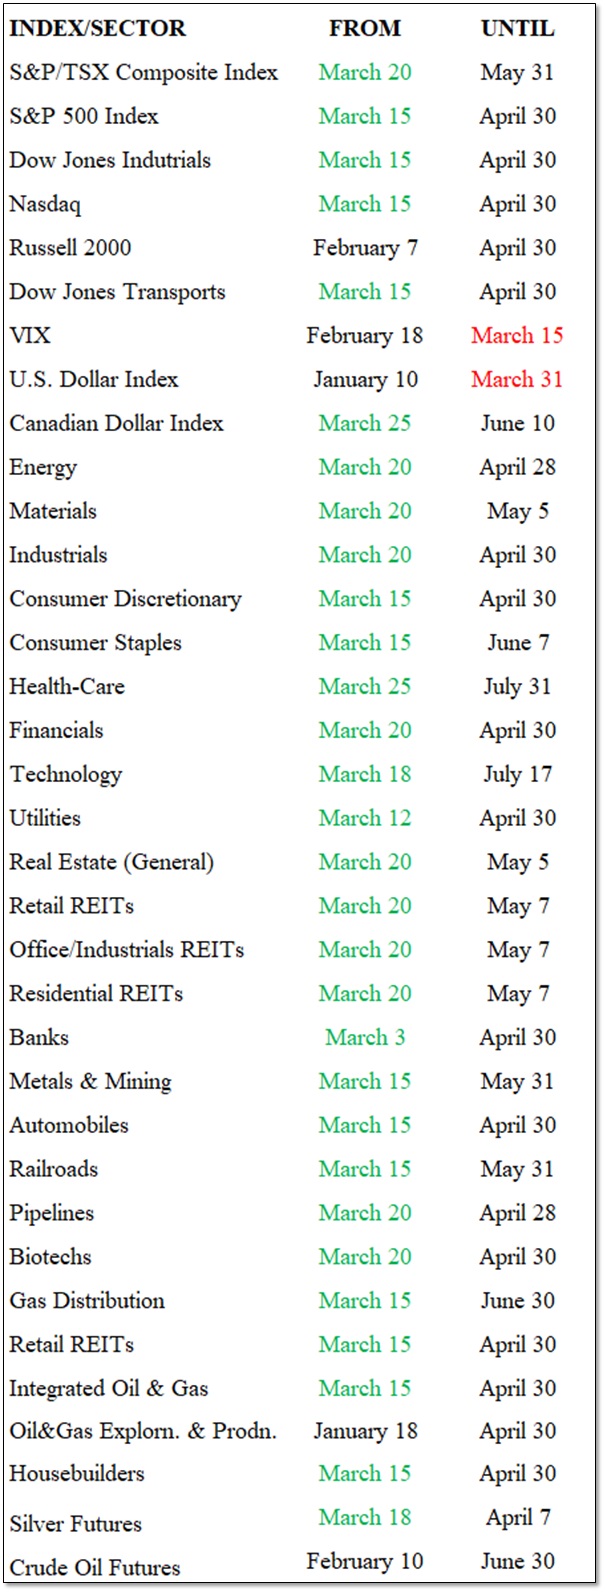
There are THIRTY market indexes/sectors that exhibit new seasonal strength in March. These are shown in the chart below. Many of the indexes/sectors are strong for a short time, completing their strength at the end of April, which corresponds with the belief that the market is generally weak beginning in May.
The TWO indexes that leave their period of seasonality strength behind this month are the VIX and the U.S. Dollar, and also shown in the chart below.
There were SIX indexes/sectors that left during the month of February. They were the VIX, Metals & Mining, Lumber, Housebuilders, and Gold and Silver Futures. The VIX, Metals & Mining, Housebuilders and Silver Futures all had a brief rest in February and then returned to another round of seasonal strength in March.
Seasonal Trends for the Market Segments in March
The following table shows which indexes/sectors gain or lose seasonal strength during the month of March. There are 30 additions this month, shown in GREEN under FROM, and there are 2 expiries this month, shown in RED under UNTIL.
NOTE: A full seasonality list of indexes and sectors is provided at the end of this report.
Figure 2: Current Seasonal Positive Strength for the Market Segments
Importance of Seasonality Trends
Seasonality refers to particular time-frames when stocks/sectors/indexes are subjected to and influenced by recurring tendencies that produce patterns that are apparent in the investment valuation process. A seasonality study preferably uses at least 10 years of data.
Seasonality Trends Chart
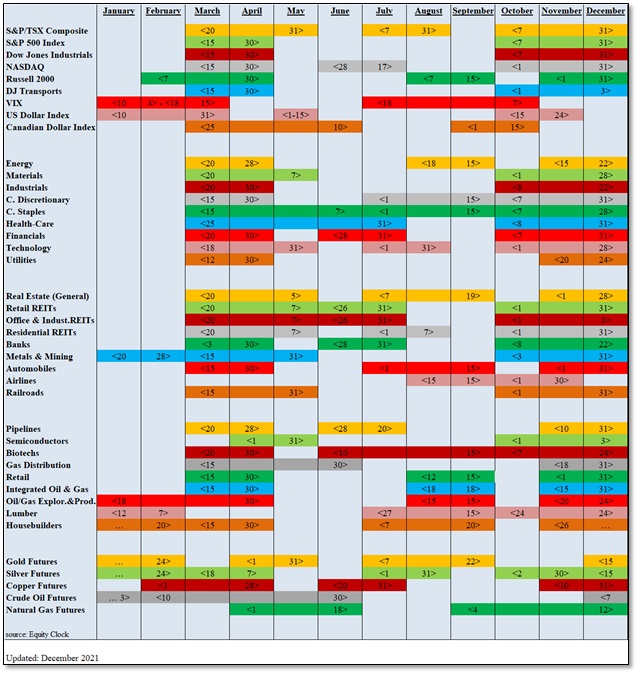
The Seasonality Trends chart below was updated in December 2021. The chart shows the periods of seasonal strength for 41 market segments (sectors/indexes). Each bar indicates a buy and a sell date (start/end dates) based upon the optimal holding period for each market sector/index. Our update involved only a few minor tweaks to the start/end dates.
The Seasonality Trends chart is an ever-changing 14-year average of the indexes and sub-indexes that we track. The information in the chart is courtesy of www.equityclock.com.
Figure 3: Seasonality Trends Chart
Notes: All numbers in CAD unless otherwise stated. The author of this report, and employees, consultants, and family of eResearch may own stock positions in companies mentioned in this article and may have been paid by a company mentioned in the article or research report. eResearch offers no representations or warranties that any of the information contained in this article is accurate or complete. Articles on eresearch.com are provided for general informational purposes only and do not constitute financial, investment, tax, legal, or accounting advice nor does it constitute an offer or solicitation to buy or sell any securities referred to. Individual circumstances and current events are critical to sound investment planning; anyone wishing to act on this information should consult with a financial advisor. The article may contain “forward-looking statements” within the meaning of applicable securities legislation. Forward-looking statements are based on the opinions and assumptions of the Company’s management as of the date made. They are inherently susceptible to uncertainty and other factors that could cause actual events/results to differ materially from these forward-looking statements. Additional risks and uncertainties, including those that the Company does not know about now or that it currently deems immaterial, may also adversely affect the Company’s business or any investment therein. Any projections given are principally intended for use as objectives and are not intended, and should not be taken, as assurances that the projected results will be obtained by the Company. The assumptions used may not prove to be accurate and a potential decline in the Company’s financial condition or results of operations may negatively impact the value of its securities. Please read eResearch’s full disclaimer.