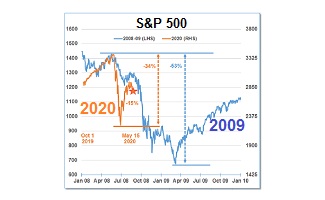
eResearch | On September 5th, we published a report on the S&P 500 Index. There has been significant movement since then that begs a fresh comment.
First, here is the two-month chart from September 5 and its accompanying “Observation”.
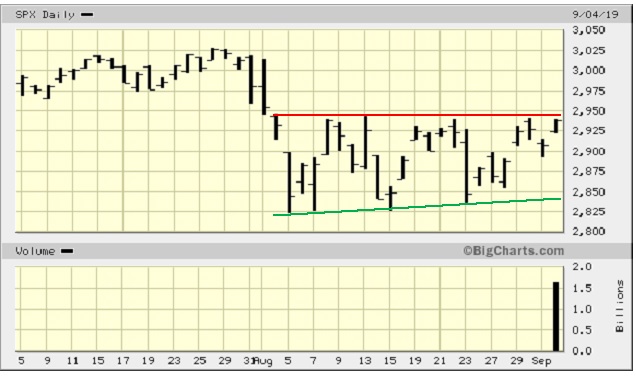
Observation: There is strong resistance at 2,945 depicted by the Red line. The slightly up-trending Green line forms a weak ascending triangle. If the Index is not able to rise above the Resistance line, then it is likely to zig-zag within the triangle until a catalyst, either positive or negative, forces it into a new trend.
Fast forward to today.
Here is the updated two-month chart. We have drawn in the same support (Green) and resistance (Red) lines from the September 5th report, and then added a current parameter (Brown), a new resistance level to overcome.
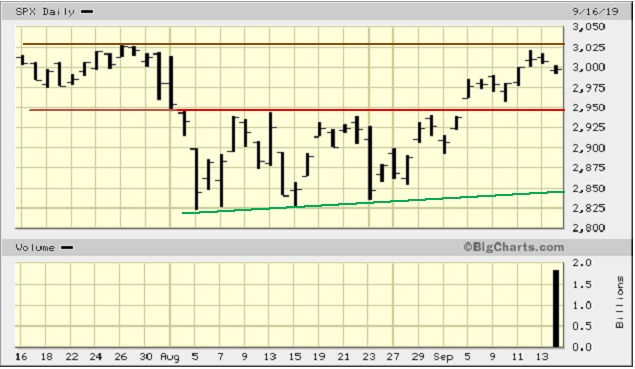
Observation: The S&P 500 Index has clearly broken out of its weak ascending triangle bounded by the Red and Green lines. We mentioned that a catalyst would be necessary to shake the Index out of the triangle, and that seems to be the conciliatory comments made last week by the leaders of China and the USA to try and find a way to resolve their trade disputes. The Index is now testing all-time highs depicted by the Brown resistance line.
Last week, the Index rose for three days (Tuesday through Thursday) and almost reached the Brown resistance line, but Friday it backed off slightly. It declined again on Monday and below the psychological 3000 level.
A new technical formation is now forming, a rectangle between the Brown resistance line at the top and the two-part Red and Red line at the bottom.
At this point, the S&P 500 Index could do one of three things: (1) Take another run at the Brown resistance line and break into a new all-time high; (2) Mark time and consolidate in the rectangle while it makes up its mind either to advance or retreat; or (3) Break down through the Red, now support line, that will change back to resistance if the Index falls back into the ascending triangle.
There is a fourth possibility, which is really an extension of the third scenario, and that is to break down below the ascending triangle and head lower.
//