eResearch | At the risk of repetition and too frequently “crying wolf”, we are repeating part of last month’s commentary as we believe it is still relevant and worth restating.
“Today’s market is beginning to discount the anticipated economic recovery that will ensue as the COVID-19 vaccination program reaches more and more citizens. But, eventually, that looking ahead will fully discount all or most eventualities associated with the COVID-related economic recovery, and the market will need a new catalyst or catalysts to propel it forward.”
To see where we are, let us examine the one-year charts for a few of the key market indexes.
CHART 1: S&P 500 Index
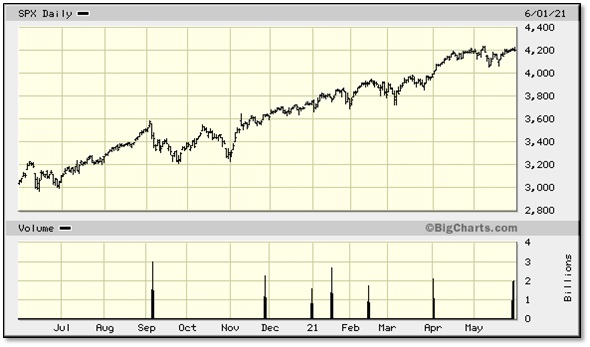
Other than a two-month pause in September and October last year, the S&P 500 Index has pretty much gone relentlessly upwards. It now looks like it might be topping out around 4,200. It seems to be forming a Double Top but it is still too soon to say definitively that this formation is valid.
CHART 2: Dow Jones Industrial Average
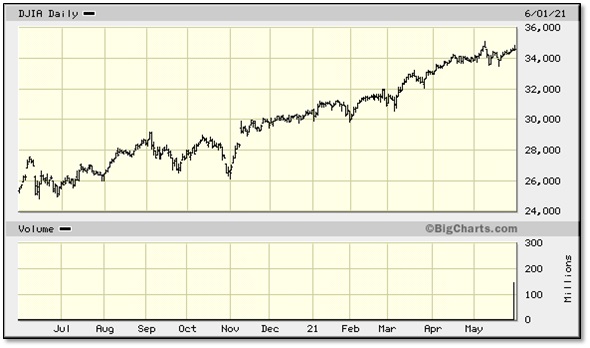
Not surprisingly, the DJIA chart looks similar to the S&P 500. The DJIA also consolidated during the months of September and October last year before resuming its upwards march to all-time highs. The DJIA is also possibly forming a Double Top but it is far too early to assume this.
CHART 3: S&P/TSX Composite index
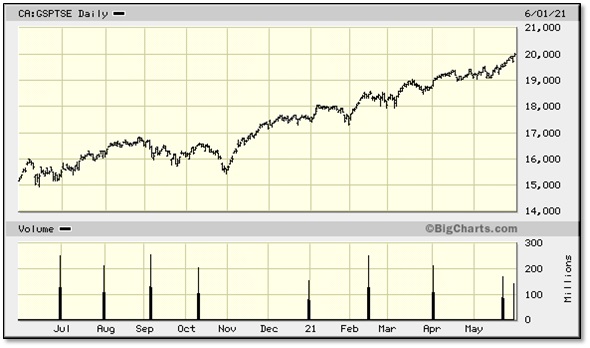
Well, “looka” here, the Canadian index is outperforming its U.S. counterparts. It also paused during September and October in 2020, but has been on a tear ever since and is taking a run at reaching 20,000, a level that it has never been at before.
Conclusion: We conclude from analyzing these three indexes, all of which are at or near their all-time highs, that a significant consolidation (i.e., a prolonged sideways movement in stock prices within a fairly narrowly defined range) is likely going to occur soon and would be a healthy occurrence for the stock market. It is not good for the market to just go up and up without a pause or pull-back before going on to new heights. Of course, a sideways consolidation may not happen but, instead, a significant pull-back may occur. For those with cash or buying power, this could present a very attractive buying opportunity.
If a consolidation or pull-back does occur over the summer months, then investors should review which indexes and sectors of the market are best placed to out-perform the others. Here is where our monthly Seasonality Trends reports would be very useful.
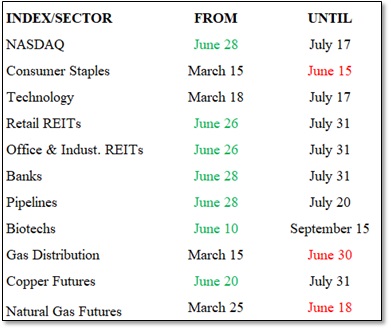
Changes for June
For June, there are seven market sectors that exhibit new seasonal strength These include three new sectors, Retail REITs, Office & Industrial REITs, and Pipelines. The other four are NASDAQ, Financials, Banks, and Biotechs.
Seasonal Trends for the Market Segments in June
The following table shows which indexes/sectors gain or lose seasonal strength during the month of June. There are 7 additions this month, shown in GREEN under FROM, and 3 expiries this month, shown in RED under UNTIL.
NOTE: A full seasonality list of indexes and sectors is provided at the end of this report.
FIGURE 1: Current Seasonal Positive Strength for the Market Segments
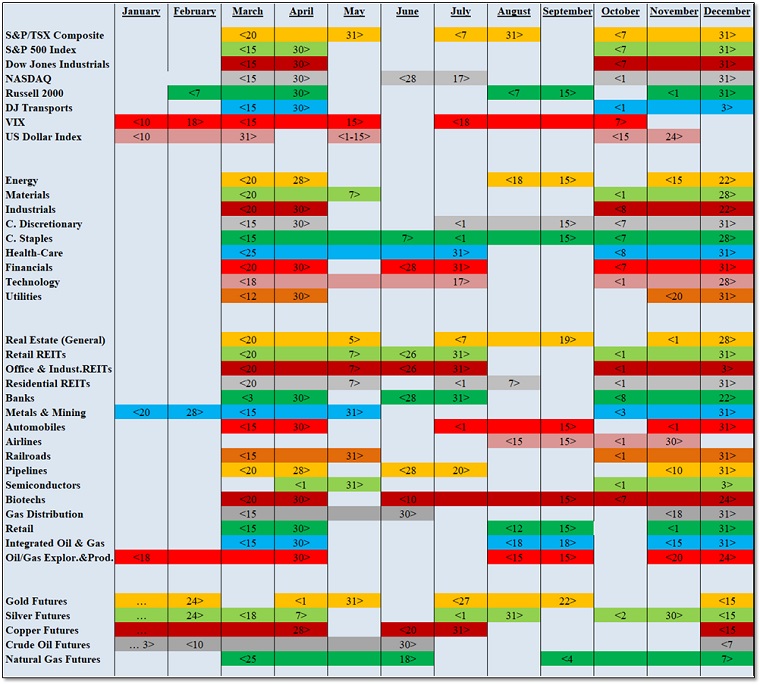
Importance of Seasonality Trends
Seasonality refers to particular time-frames when stocks/sectors/indexes are subjected to and influenced by recurring tendencies that produce patterns that are apparent in the investment valuation process. A seasonality study preferably uses at least 10 years of data.
Seasonality Trends Chart
The Seasonality Trends chart below was updated in June 2021. The chart shows the periods of seasonal strength for 38 (formerly 28) market segments (sectors/indexes). Each bar indicates a buy and a sell date based upon the optimal holding period for each market sector/index.
The ten new industry sectors are (1) Retail REITs, (2) Office & Industrial REITs, (3) Residential REITs, (4) Pipelines, (5) Semiconductors, (6) Integrated Oil & Gas, (7) Crude Oil Futures, (8) Automobiles, (9) Airlines, and (10) Railroads.
The Seasonality trends chart is an ever-changing 14-year average of the indexes and sub-indexes that we track. The information in the chart is courtesy of www.equityclock.com.
FIGURE 2: Seasonality Trends Chart
Notes: All numbers in USD unless otherwise stated. The author of this report, and employees, consultants, and family of eResearch may own stock positions in companies mentioned in this article and may have been paid by a company mentioned in the article or research report. eResearch offers no representations or warranties that any of the information contained in this article is accurate or complete. Articles on eresearch.com are provided for general informational purposes only and do not constitute financial, investment, tax, legal, or accounting advice nor does it constitute an offer or solicitation to buy or sell any securities referred to. Individual circumstances and current events are critical to sound investment planning; anyone wishing to act on this information should consult with a financial advisor. The article may contain “forward-looking statements” within the meaning of applicable securities legislation. Forward-looking statements are based on the opinions and assumptions of the Company’s management as of the date made. They are inherently susceptible to uncertainty and other factors that could cause actual events/results to differ materially from these forward-looking statements. Additional risks and uncertainties, including those that the Company does not know about now or that it currently deems immaterial, may also adversely affect the Company’s business or any investment therein. Any projections given are principally intended for use as objectives and are not intended, and should not be taken, as assurances that the projected results will be obtained by the Company. The assumptions used may not prove to be accurate and a potential decline in the Company’s financial condition or results of operations may negatively impact the value of its securities. Please read eResearch’s full disclaimer.