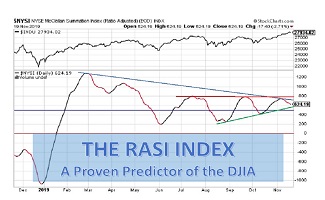
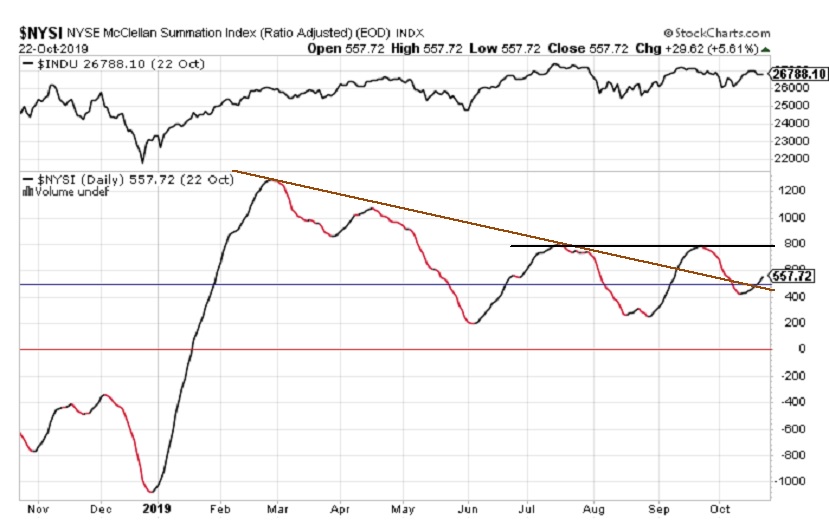
eResearch | The RASI at the close on Tuesday, October 22 is at 557. This is up from 449 a week ago. More importantly, the Index has risen above two critical resistance levels, as shown in our chart below.
First, the Index has broken above the Brown extended down-trend line that began near the end of February around 1300. This now brings into play a new resistance line, shown in Black, which represents a Double Top at 800. The Index is now poised to test that resistance level.
Second, the Index has regained “Positive” territory by rising above the benchmark 500 level (the horizontal Blue line) that denotes the dividing line between Positive and Negative market expectation.
Now the challenge for the Index, other than breaking through the 800 resistance level, is to stay in Positive territory above the 500 line. If the Index cannot stay above the 500 level, then this would imply negative implications for the market’s future direction.
Significance of RASI Index for the Market
The significance of the RASI Index is that it has proven to be a good predictor of the future direction of the DJIA. The upper section of the chart depicts the closing prices of the DJIA and, clearly, there is a good correlation between the two indexes. Since the lows of mid to late August, the RASI and the DJIA both moved higher in unison and, since mid-September, they both moved lower together. Now, both Indexes are trying to establish a new up-trend. In this regard, the Index is doing better than the Dow. The DJIA is having difficulty breaking through its Double Top at 27,300-27,400. Currently, it is at 26,835 and has been moving sideways over the past ten trading days.
Downside Support
If the Index stalls and resumes its downward trend back below both the 500 level and the former Brown down-trend line, then the next levels of support are provided by the June low and then the August low, which translates into a range of about 200-220. That range is a long way below the current Index reading. However, if these downside levels are reached, then this could indicate that the DJIA might test its August lows around 25,500 or even its early June lows below 25,000 at about 24,750.
Upside Resistance
If the Index is able to continue to rally, then it will have to overcome resistance provided by the Double Top (Black line) at about 800, which is a significant 44% above its current level.
//
What is the Ratio-Adjusted Summation Index (RASI)?
- The Ratio-Adjusted Summation Index, RASI, is a market indicator developed by Tom McClellan of McClellan Financial Publications.
- A RASI reading that rises to and reaches a specified level (500 and above) can be a signal that a new market up-trend is starting.
- The +500 level is an important dividing line for the RASI, in terms of giving a go/no-go signal about the new up-trend.
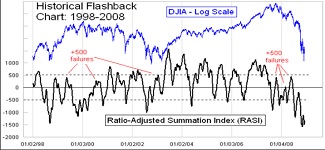
- When a rebound in the RASI occurs, but it falls short of getting up to the 500 level, historically that has meant trouble lies ahead.
- But zooming well above 500 is a sign that there is a lot of strength behind the move, and the higher it goes above 500, the more emphatic the message of strength.
- Conversely, a move from well above 500 down to and below 500 is a signal that the market is weakening and that it should move lower.
//