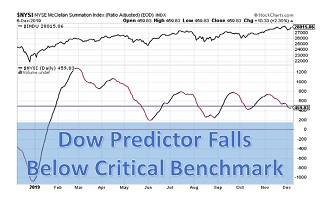
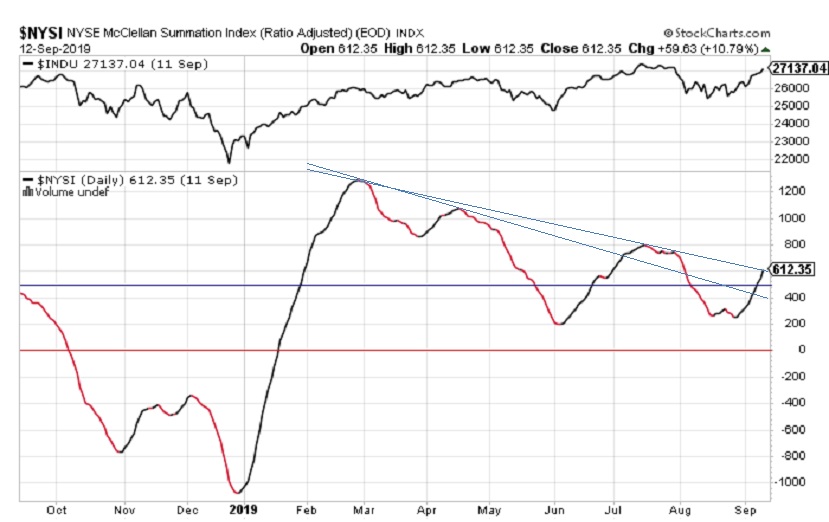
The RASI at the close on Wednesday, September 18 is at 765. This is up from 612 at the time of our last report a week ago. Of greater significance is that the Index continues to rally increasingly above the critical 500 level, which denotes the dividing line between Positive and Negative market expectation.
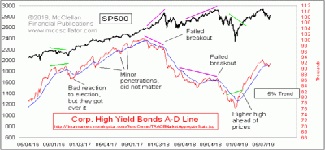
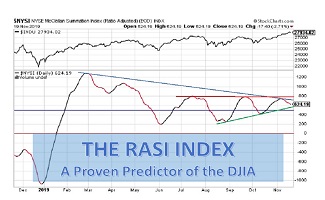
The RASI Index has proven to be a good predictor of the future direction of the DJIA. This is clearly shown in the top part of the chart below where the DJIA is recorded. Since the lows of mid to late August, the RASI and the DJIA have both moved higher in unison. The DJIA, like the broader-based S&P 500 Index, now sits just under its all-time high and is attempting to break through this into new ground.
As shown on the chart, RASI has broken through both down-trend lines that emanate from the late February high around 1300. This is significant as it indicates that RASI has continuing follow-through strength to move higher. And if it stalls and heads lower, there are now two significant longer-term support lines (the two down-trend lines).
Conclusion
The RASI Index has been gaining momentum since the end of August. It has broken through (i) the key 500 level, (ii) the first line of resistance, the blue lower down-trend line, and, finally (iii) the second line of resistance, the black upper down-trend line. This provides a strong indication that the Index will continue higher. The corollary is that the DJIA can be expected to move higher in tandem.