eResearch | We are using the Friday closing price for RASI and, henceforth, will be reporting every two weeks. However, we are now collecting the Index on a daily basis and will be including readings in both table and chart form once sufficient data has been assembled.
Index Reading At Friday December 6 Close
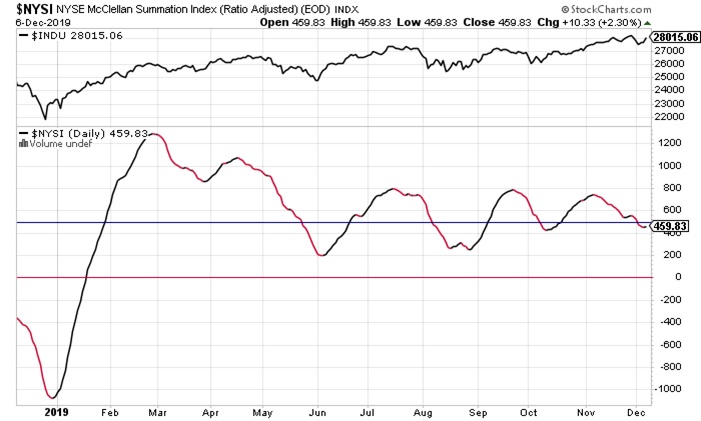
The RASI at the close on Friday, December 6 is at 460. The Index fell below the 500 benchmark on Tuesday. This benchmark 500 level demarks the transition from a “Positive” market outlook to a “Negative” one.
Down-Side Possibilities
Now that the 500 benchmark has been breached, what are the downside possibilities for RASI? The first support level would be at the October low of 425 (-7.6%). The next levels of support are provided by the August low and then the June low, which translates into a range of about 200-220 (around 50%! below the current reading).
Conclusion
RASI is on the decline and has dropped below the significant 500 benchmark. This means the outlook for the market is Negative.
Significance of RASI Index for the Market
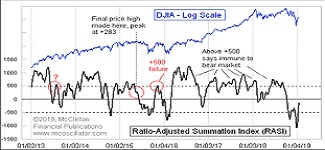
The RASI Index has proven to be a good predictor of the future direction of the DJIA. The upper section of the chart above depicts the closing prices of the DJIA and, clearly, there is a good correlation between the two indexes. Since the lows of mid to late August, the RASI and the DJIA both moved higher in unison and, from mid-September until almost mid-October, they both moved lower together. At that point, they both moved higher together until the beginning of November. Then, the two indexes diverged. The RASI has moved considerably lower, while the DJIA has continued higher.
While short-term aberrations between the two Indexes can occur from time to time, a prolonged divergence ultimately ends with the Indexes moving back in sync together. Since this divergence has been trending since the beginning of November, either the RASI will have to turn back up to match the DJIA’s upward trend, or the DJIA is about to fall to catch up to the RASI’s month-long decline. We remain on watch.
#####
What is the Ratio-Adjusted Summation Index (RASI)?
- The Ratio-Adjusted Summation Index, RASI, is a market indicator developed by Tom McClellan of McClellan Financial Publications.
- A RASI reading that rises to and reaches a specified level (500 and above) can be a signal that a new market up-trend is starting.
- The +500 level is an important dividing line for the RASI, in terms of giving a go/no-go signal about the new up-trend.
- When a rebound in the RASI occurs, but it falls short of getting up to the 500 level, historically that has meant trouble lies ahead.
- But zooming well above 500 is a sign that there is a lot of strength behind the move, and the higher it goes above 500, the more emphatic the message of strength.
- Conversely, a move from well above 500 down to and below 500 is a signal that the market is weakening and that it should move lower.