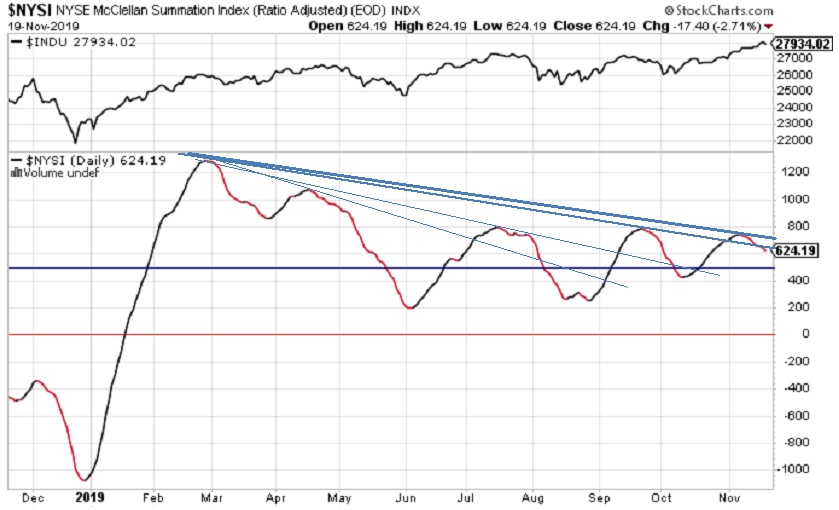
eResearch | The RASI at the close on Tuesday, November 19 is at 624. This is down from 698 a week ago and 741 two weeks ago. The Index reached a recent high three weeks ago, at 743.50, and then declined continually since then. For the time being, the Index has backed off challenging resistance at 800. It is currently in moderate retreat.
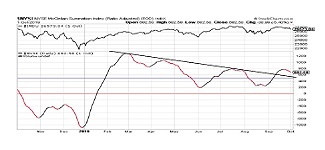
On the chart below, we have drawn four down-trend lines from the February high around 1,300. The lower two are no longer in play. The upper two are close together at the moment. The thicker top BLUE down-trend line is the one we are now watching more closely.
Down-Trend Lines
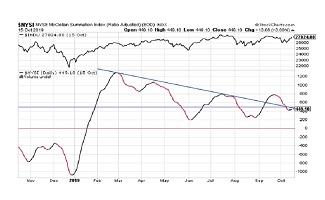
Two Technically-Positive Triangles
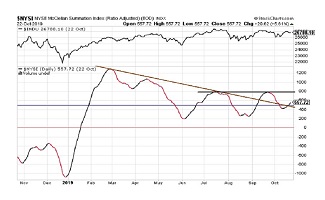
The next chart shows the BLUE down-trend line, as before. It also shows the RED resistance line that intercepts 800. And then there is the GREEN up-trend line.
The Index can now be considered to be trending within two triangles. One triangle is bounded by the BLUE down-trend line and the GREEN up-trend line, and the other triangle is bounded by the horizontal RED resistance line and the GREEN up-trend line. In both instances, the Index is declining away from the top of the triangle. The ebb and flow could continue for a while.
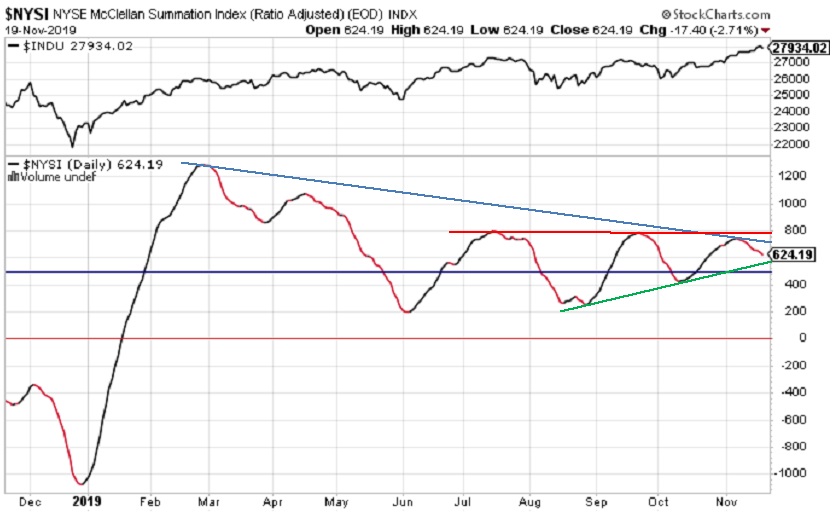
Significance of RASI Index for the Market
The significance of the RASI Index is that it has proven to be a good predictor of the future direction of the DJIA. The upper section of the chart above depicts the closing prices of the DJIA and, clearly, there is a good correlation between the two indexes. Since the lows of mid to late August, the RASI and the DJIA both moved higher in unison and, from mid-September until almost mid-October, they both moved lower together. At that point, they both moved higher together until the beginning of November. Then, the two indexes diverged. The RASI has moved considerably lower, while the DJIA has continued higher. With the RASI declining, is the turn-down in the DJIA on Tuesday, November 19 the start of the DJIA’s decline?
///
What is the Ratio-Adjusted Summation Index (RASI)?
- The Ratio-Adjusted Summation Index, RASI, is a market indicator developed by Tom McClellan of McClellan Financial Publications.
- A RASI reading that rises to and reaches a specified level (500 and above) can be a signal that a new market up-trend is starting.
- The +500 level is an important dividing line for the RASI, in terms of giving a go/no-go signal about the new up-trend.
- When a rebound in the RASI occurs, but it falls short of getting up to the 500 level, historically that has meant trouble lies ahead.
///