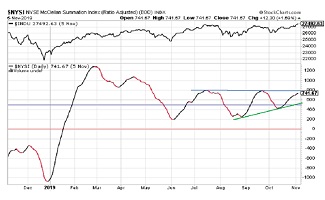
eResearch | The RASI at the close on Tuesday, October 15 is at 449. This is essentially unchanged from 442 recorded in our report last week.. The chart below shows that the Index has stalled in its downward trend and has moved ever so slightly higher in the last few days.
The Index is now trying to regain its Positive status. To achieve this, it must continue higher and move above the 500 mark, the level that denotes the dividing line between Positive and Negative market expectation.
If the Index cannot rise above the 500 level, then this would imply negative implications for the market’s future direction.
Significance of RASI Index for the Market
The significance of the RASI Index is that it has proven to be a good predictor of the future direction of the DJIA. The upper section of the chart depicts the closing prices of the DJIA and, clearly, there is a good correlation between the two indexes. Since the lows of mid to late August, the RASI and the DJIA both moved higher in unison and, since mid-September, they both moved lower together. Now, both Indexes are trying to establish a new up-trend.
Downside Support
If the Index resumes its downward trend below both the 500 level and the down-trend line, then the next levels of support are provided by the June low and then the August low, which translates into a range of about 200-220. That range is still a long way below the current Index reading. If these downside levels are reached, this could indicate that the DJIA might test its August lows around 25,500 or even its early June lows below 25,000 at about 24,750.
Upside Resistance
If the Index is able to rally, then it will have to overcome resistance provided by both the down-trend line at about 490 and the benchmark 500 level. Since these two resistance points are currently close to one another, the Index may have some difficulty overcoming them. Or, it could blast right through them. A significant market catalyst would probably be necessary to achieve that outcome.
//
What is the Ratio-Adjusted Summation Index (RASI)?
- The Ratio-Adjusted Summation Index, RASI, is a market indicator developed by Tom McClellan of McClellan Financial Publications.
- A RASI reading that rises to and reaches a specified level (500 and above) can be a signal that a new market up-trend is starting.
- The +500 level is an important dividing line for the RASI, in terms of giving a go/no-go signal about the new up-trend.
- When a rebound in the RASI occurs, but it falls short of getting up to the 500 level, historically that has meant trouble lies ahead.
- But zooming well above 500 is a sign that there is a lot of strength behind the move, and the higher it goes above 500, the more emphatic the message of strength.
- Conversely, a move from well above 500 down to and below 500 is a signal that the market is weakening and that it should move lower.
//