You can access this week’s RASI Report here: … … McC_Rasi041219

Chart-of-the-Day
CHART OF THE DAY – Spotlight on the S&P/TSX Composite Index
The S&P/TSX Composite Index has reached an important point at its current level. Right now, we have the forming of a possible Double Top around 18,000. A break-down from here could possibly lead to many months before the Index challenged the 18,000 level again. [more]
Analyst Articles
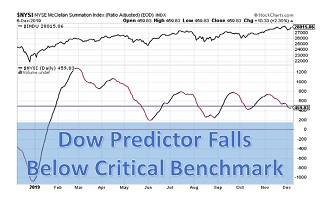
RASI: Index Falls Below Critical 500 Benchmark
Last week, the RASI declined below the important 500 level. This is bearish as it signals that the outlook for the stock market is Negative. Right now, the RASI and the DJIA are diverging, with the RASI declining and the DJIA rising. A divergent trend rarely lasts long. [more]

Technical Pundits
TheUpTrend.com: Technical Video – Wednesday, March 20, 2019
eResearch is pleased to provide the daily market video from TheUpTrend.com, which is a proprietary technical analysis system, devised by Stephen Whiteside, that uses charts and various technical tools to maximize trading and investing experiences. TheUpTrend.com provides intra-day, daily, weekly, and monthly technical analysis on global stocks, indexes, ETFs, and futures. [more]