The S&P/TSX Composite Index (“S&P/TSX” or the “Index”) has reached an important point at its current level. Right now, we have the forming of a possible Double Top around 18,000. A break-down from here could possibly lead to many months before the Index challenges the 18,000 level again. A break-out from the current level would be very bullish for the Canadian index. The ten-year charts for the Canadian and U.S. broad indexes are compared below.
Chart 1: Ten-Year Chart: S&P/TSX Composite Index
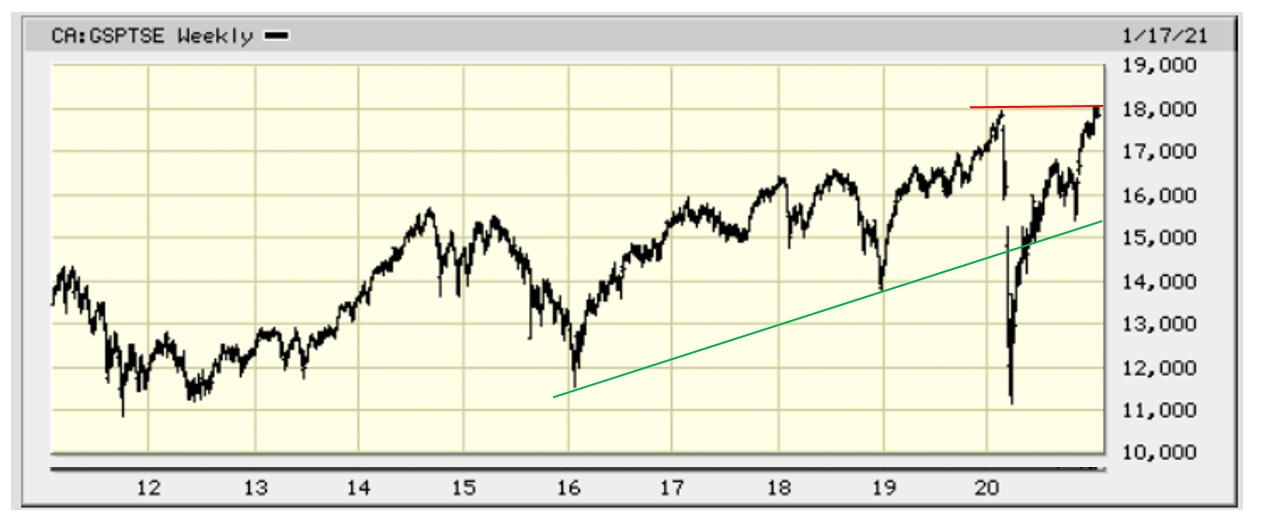
Chart 2: Ten-Year Chart: S&P 500 Index
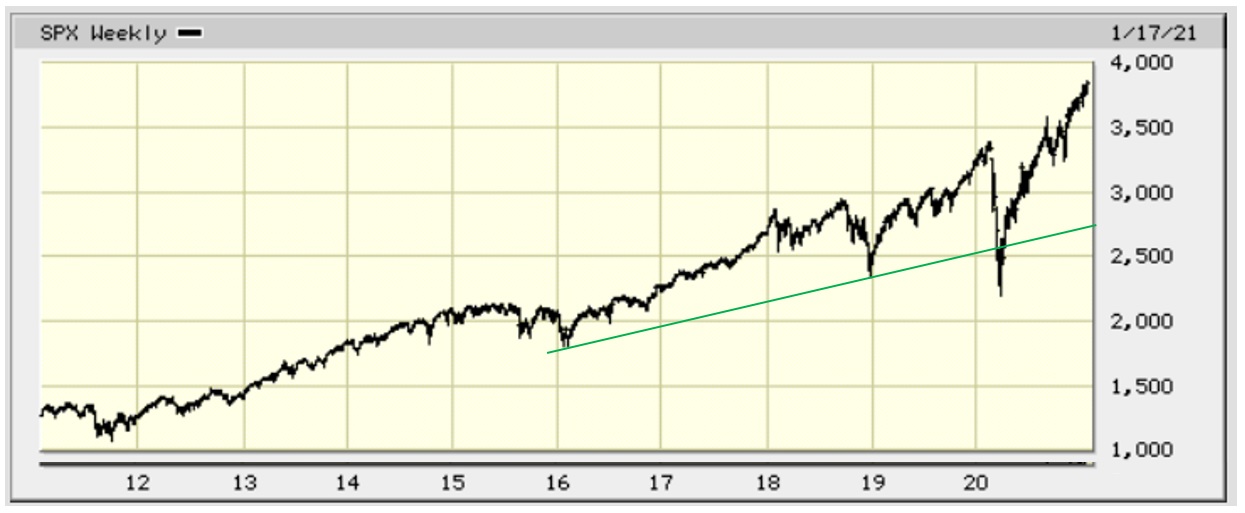
COMMENT: Our rule-of-thumb for recognizing a break-out (or break-down) is a move of 3% above (below) the resistance (support) line.
The S&P/TSX reached a high of 17,970 in early 2020. Its latest high on January 8, 2021, is 18,058. That is only 0.5% higher than the 2020 high. To reach a close of 3% above the 17,970 reading would be 18,509. (See arrow below.)
Chart 3: One-Year Chart: S&P/TSX Composite Index
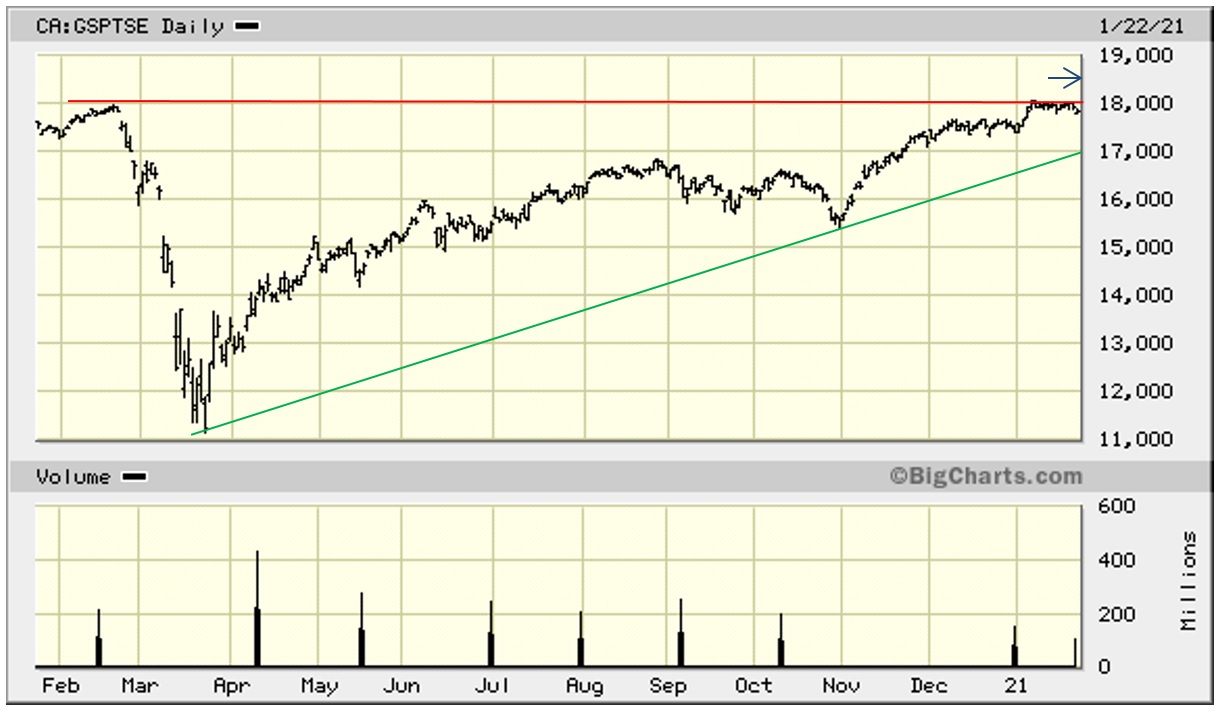
Observation: Note: Ignore the Volume indicators. Volume measures were discontinued in 2019. (I don’t know why.) The current Double Top (Red line) is still in the process of forming. (It is too early to state that it is an actual double top. Also, the longer the time for the forming of a technical formation, the less “strength” that formation has. This Double Top is almost one year in the making.) The rising trend-line (Green line) that started in March 2020 at the low of the COVID-19-driven panic is still intact, and is currently around 17,000, meaning the bullish market that began last March could drop 1,000 points from here and still be valid. So, the Index has a useful buffer in place.
CONCLUSION: Many market pundits are saying that the market is way over-extended. In our opinion, the market does not look “frothy” and the up-trend looks destined to continue.
The market is currently fixated on just two things: (1) The amount of USD stimulus to be pumped into the economy to defeat the virus and get the economy moving again; and (2) When the populous is going to be vaccinated in order to accomplish #1.
Once the market realizes that there will be no further $ stimulus (Biden faces a few hurdles to get his US$1.9 trillion corona package accepted), there should be a meaningful pull-back. This might not occur for six months or more, but once the market realizes that there is no more wind in the sails, it is likely to flounder on the rocks for a while. This is normal and this is healthy.
Canadians are definitely concerned about the Biden Administration’s approach to the U.S. economy, because what affects the USA equally affects Canada.
To download the PDF report, click DayChart_012221_TSX300.
Bob Weir, CFA
Contributing Analyst