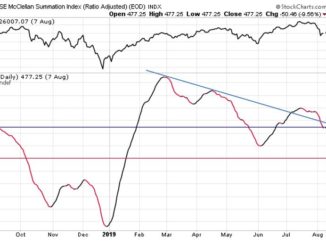
eResearch | The RASI at the close on Tuesday, October 1 is at 682. This is down from 772 in our report last week. As shown on the chart, the Index is “rolling over”, which likely means that it is running out of steam. This could be a permanent pause after its run-up from the August lows of just “north” of 200, and then morph into a sustained downward move to, perhaps, test the August or early-June lows. Or, RASI could be marking time awaiting the next catalyst to resume its upward move.
Whatever, for now, the Index remains well above the benchmark 500 level, which denotes the dividing line between Positive and Negative market expectation.
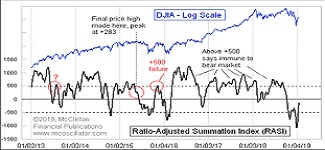
The significance of the RASI Index is that it has proven to be a good predictor of the future direction of the DJIA. The upper section of the chart depicts the closing prices of the DJIA and, clearly, there is a good correlation between the two indexes. Since the lows of mid to late August, the RASI and the DJIA both moved higher in unison, and the most recent movement shows the two indexes both “rolling over” and heading lower.
The chart shows that the RASI remains above its down-trend line that started in late February around 1300. If the RASI continues to move lower, there are two significant Support levels for it, being the down-trend line and then the 500 benchmark level. However, these two Support levels are now converging.

#####
What is the Ratio-Adjusted Summation Index (RASI)?
- The Ratio-Adjusted Summation Index, RASI, is a market indicator developed by Tom McClellan of McClellan Financial Publications.
- A RASI reading that rises to and reaches a specified level (500 and above) can be a signal that a new market up-trend is starting.
- The +500 level is an important dividing line for the RASI, in terms of giving a go/no-go signal about the new up-trend.
- When a rebound in the RASI occurs, but it falls short of getting up to the 500 level, historically that has meant trouble lies ahead.
- But zooming well above 500 is a sign that there is a lot of strength behind the move, and the higher it goes above 500, the more emphatic the message of strength.
- Conversely, a move from well above 500 down to and below 500 is a signal that the market is weakening and that it should move lower.