This is an update article to the original article dated September 20, 2021: https://eresearch.com/2021/09/21/eresearch-reports/chart-of-the-day/chart-of-the-day-suncor-energy-inc/
UPDATE
The share price for Suncor (TSX: SU; and NYSE: SU) in our September 20 article was C$24.27 (closing price from Friday, September 17).
The stock closed on Friday, October 8 at C$28.81, a gain of 19%. Not bad for three weeks work! Wish all of my stock purchases were like that. Alas!
In our Original article, we stated:
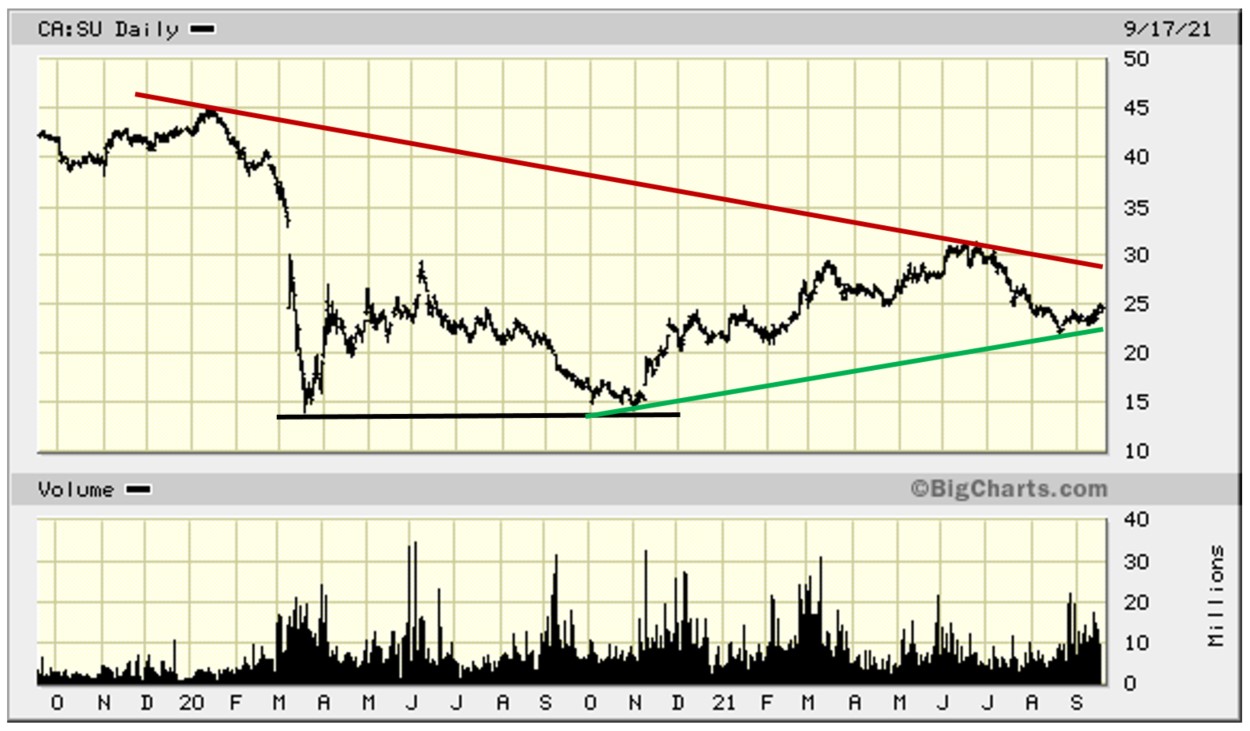
Turning to SU, its RUST longer-term down trend-line line [see Chart below] currently sits just under $30, which is about 20% above the current stock price. Still a bit to go, but certainly achievable. If SU can break above this declining down trend-line, this would be very favourable for the stock, with greater expectations for further appreciation. The Double Bottom BLACK line that formed over a seven-month period is also bullish. On a cautious note, it is important for the stock to continue to trend above its GREEN up-trend Support line. Falling below it for an appreciable time would be quite bearish.
Here is Chart 2 from our September 20 Article.
Chart 2 (September 20 Article): Two-Year Performance
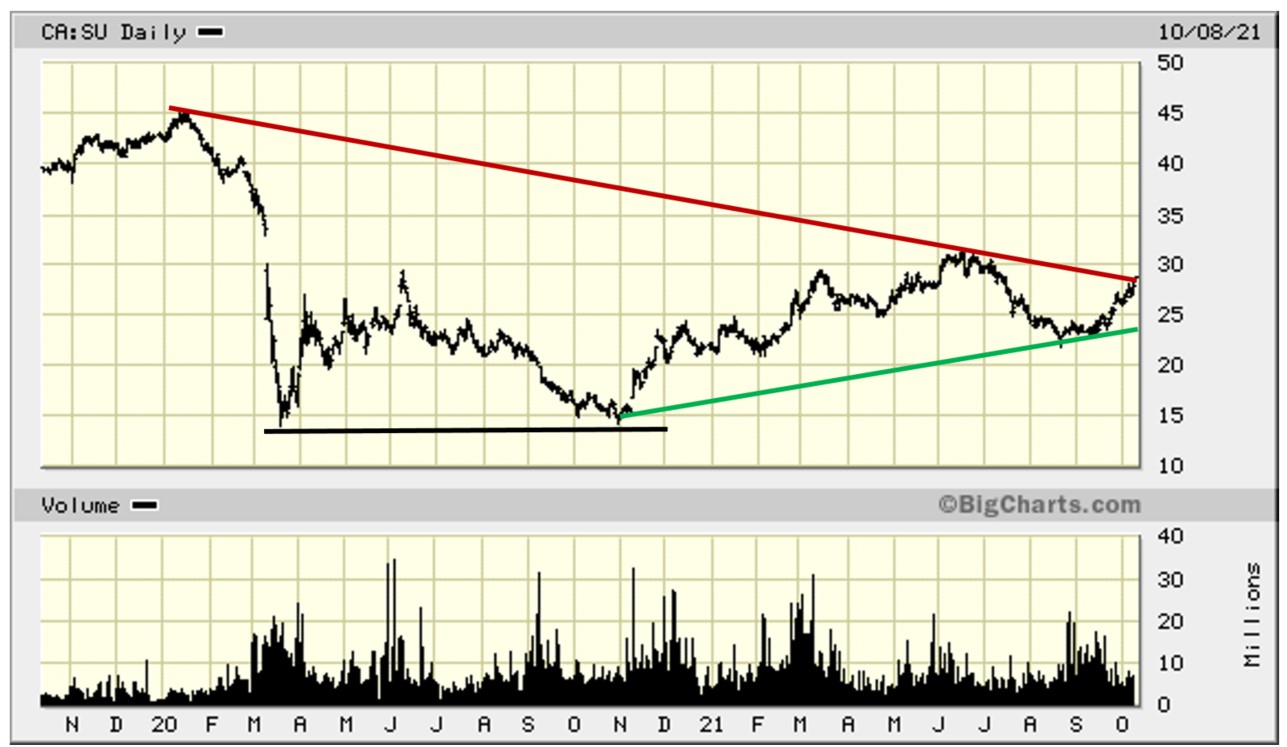
Let us bring this chart up to date. We will put the same chart lines into the current chart.
Chart 2 (This Article): Two-Year Performance
COMMENT
The stock has now reached its RUST down-trend line. This is a critical juncture.
If SU can break through this Resistance line with conviction, then higher prices are indicated, and, perhaps, it could test its two-year high of C$45 in January 2020.
If the stock is thwarted by this Resistance level, it could go back to test its GREEN rising up-trend line. If that Support level holds, then we would anticipate another run at the declining Resistance line. If it does not hold, then a return to test the support prices represented by the BLACK Double Bottom comes into play.
SIX-MONTH PERFORMANCE
Let us have a look at the last six months of stock performance.
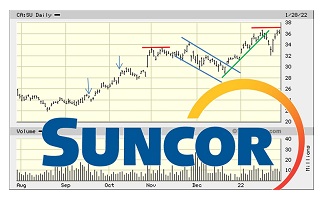
Chart A: Six-Month Performance
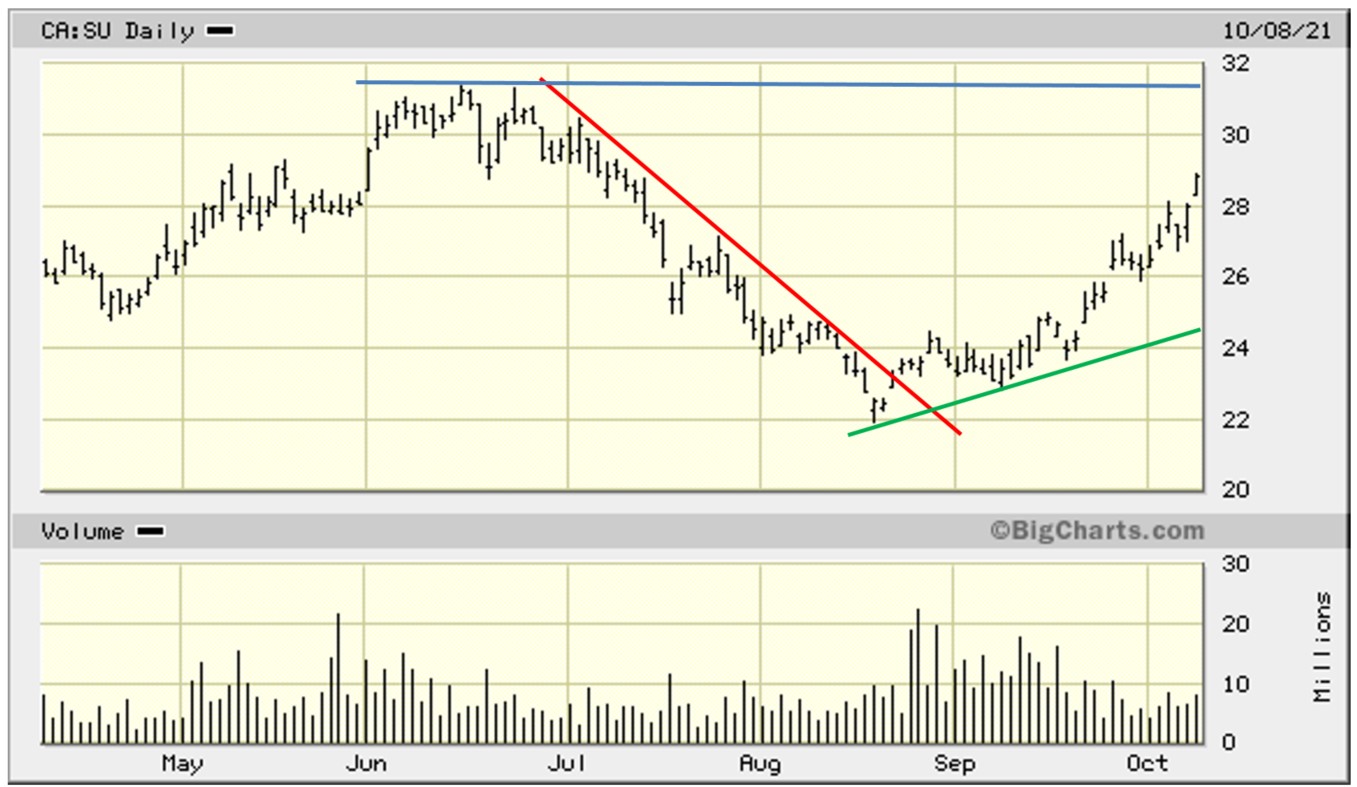
Observation: The RED down trend-line has been significantly broken to the upside, and the stock has been climbing comfortably above its rising GREEN up trend-line. The BLUE Resistance trend-line at around C$31½ represents the next target, which could be a suitable exit point for shorter-term traders.
Notes: All numbers in CAD unless otherwise stated. The author of this report, and employees, consultants, and family of eResearch may own stock positions in companies mentioned in this article and may have been paid by a company mentioned in the article or research report. eResearch offers no representations or warranties that any of the information contained in this article is accurate or complete. Articles on eresearch.com are provided for general informational purposes only and do not constitute financial, investment, tax, legal, or accounting advice nor does it constitute an offer or solicitation to buy or sell any securities referred to. Individual circumstances and current events are critical to sound investment planning; anyone wishing to act on this information should consult with a financial advisor. The article may contain “forward-looking statements” within the meaning of applicable securities legislation. Forward-looking statements are based on the opinions and assumptions of the Company’s management as of the date made. They are inherently susceptible to uncertainty and other factors that could cause actual events/results to differ materially from these forward-looking statements. Additional risks and uncertainties, including those that the Company does not know about now or that it currently deems immaterial, may also adversely affect the Company’s business or any investment therein. Any projections given are principally intended for use as objectives and are not intended, and should not be taken, as assurances that the projected results will be obtained by the Company. The assumptions used may not prove to be accurate and a potential decline in the Company’s financial condition or results of operations may negatively impact the value of its securities. Please read eResearch’s full disclaimer.