eResearch | The Energy sector has not performed well over the past ten years. However, some oil & gas equities have done better than others.
One of the laggards in the last few years is Suncor Energy Inc. (TSX: SU). This can be attributed to its almost singular focus on its oil sands projects. But, like many other senior O&G companies, Suncor is now seriously evaluating non-fossil fuels opportunities.
Suncor has the heft to make a meaningful impact with renewable energy projects, and any success is likely to result in a re-rating of its shares. The recent announcement of a joint buying decision with several Indigenous groups is an example of how these senior O&G companies are coming to grips with the new energy reality.
FIGURE 1: Ten-Year Performance
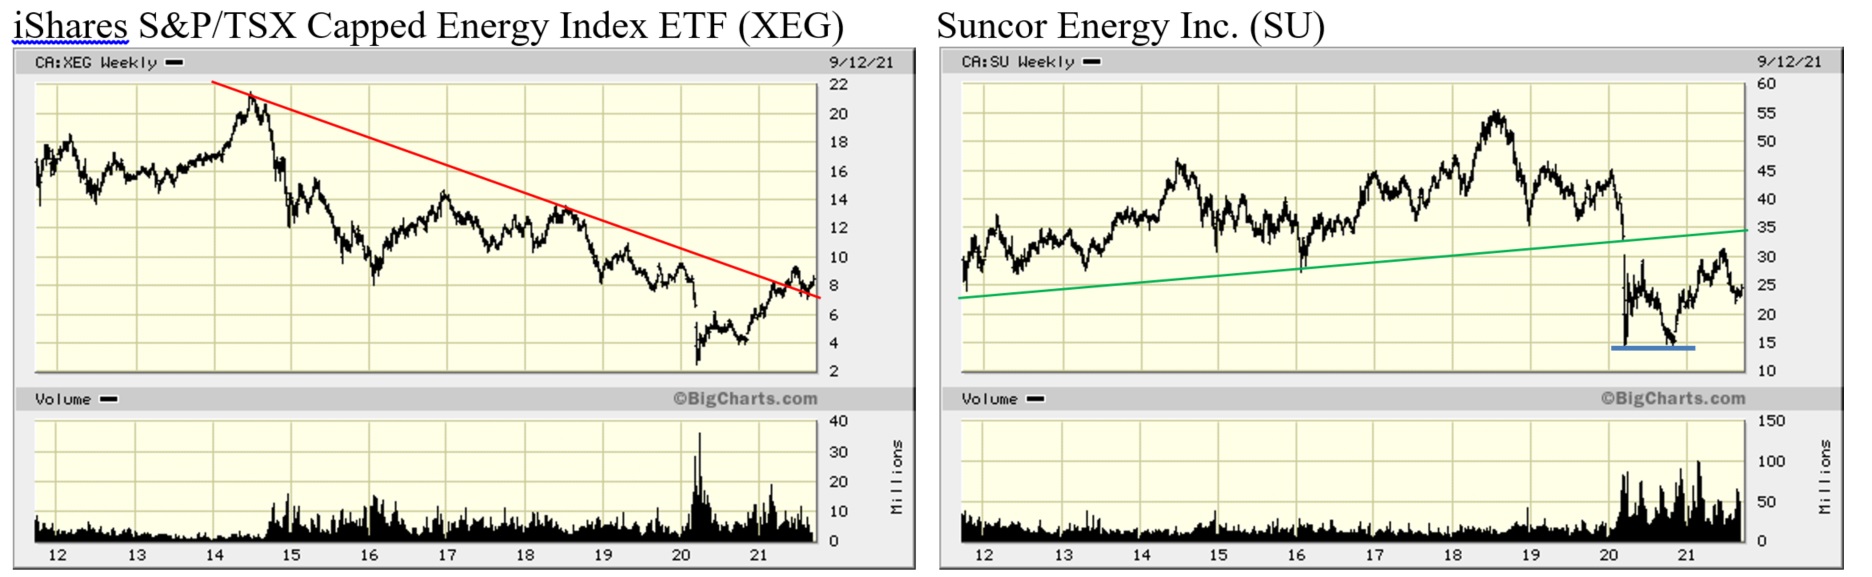
Observation: Clearly, the Canadian energy sector has not been a great investment segment over the past ten years. The XEG ETF started the decade around $14 and ended up around $9! Suncor fared a bit better, starting and ending ten years later at around $25. Not exactly a sterling performance. On a positive note, the XEG has broken above its multi-year down-trend RED line. SU still has to “fill” the Open Gap between $33 and $30 that formed with the precipitous fall in the market in March 2020. On a positive note for SU, it formed a bullish Double Bottom (BLUE line) in 2020.
Let us have a look at the last two years, which takes into account the COVID decline and the subsequent recovery.
FIGURE 2: Two-Year Performance
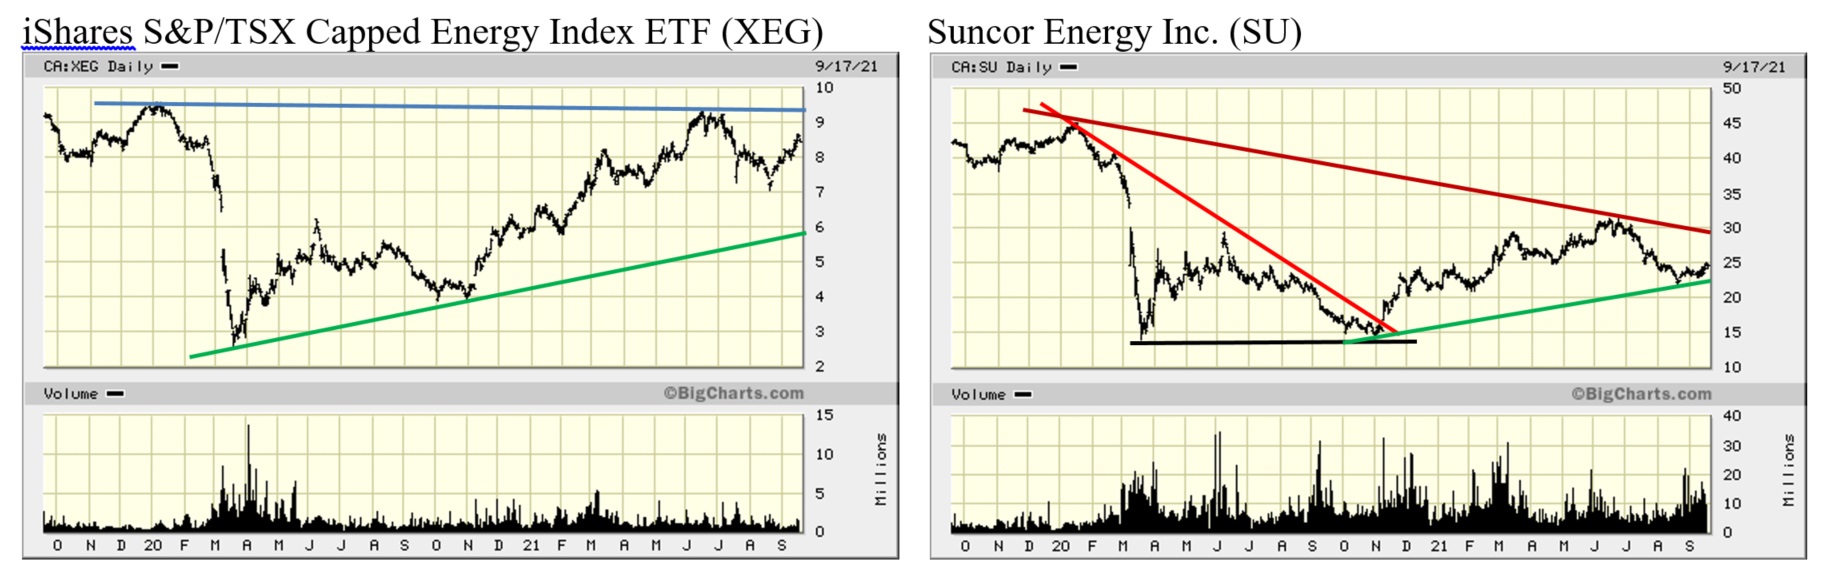
Observation: XEG has risen from a March 2020 low of $2.72 to the current $8.45, a gain of 211%. SU, in the meantime, rose from a low of $14.02 to the current $24.67, a gain of 76%. We attribute the lagging SU to its focus on oil sands development and the increasing hue and cry by environmentalists and now others to divest our energy interests away from fossil fuels. SU, like many other oil exploration & development companies, is investigating alternate energy forms, but its oil sands projects will dominate its operations for years to come.
Observation: XEG formed an impressive Double Top by regaining the pre-COVID decline level, as shown by the BLUE Resistance line. The first test of that resistance level (around $9.40-$9.50) will be an important determinant of the Index’s near-term direction. Failing to rise above it would indicate that further short-term negative performance is likely, while an upwards breach of the line would indicate a continuation of the short-term bullish sentiment that began in the last half of August. The GREEN trend-line support level is well below current prices at around $5.80.
Observation: Turning to SU, its RUST longer-term down trend-line line currently sits just under $30, which is about 20% above the current stock price. Still a bit to go, but certainly achievable. If SU can break above this declining down trend-line, this would be very favourable for the stock, with greater expectations for further appreciation. The Double Bottom BLACK line that formed over a seven-month period is also bullish. On a cautious note, it is important for the stock to continue to trend above its GREEN up-trend Support line. Falling below it for an appreciable time would be quite bearish.
FIGURE 3: Suncor One-Year Performance
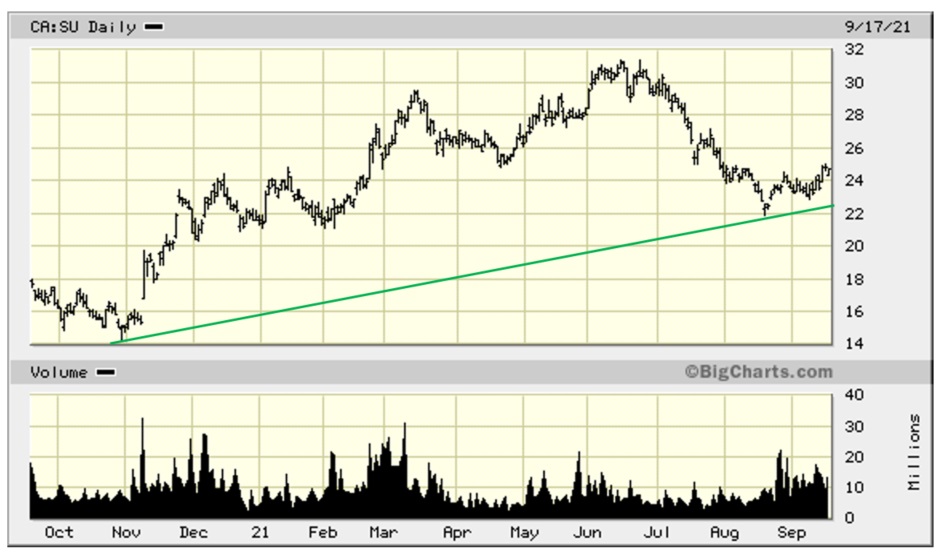
Observation: We have drawn the same GREEN up-trend line that was provided in FIGURE 2. But, look closely, do you see the Head & Shoulders Bottom that has/is forming? We will analyze that in the next chart.
FIGURE 4: Suncor Six-Month Performance
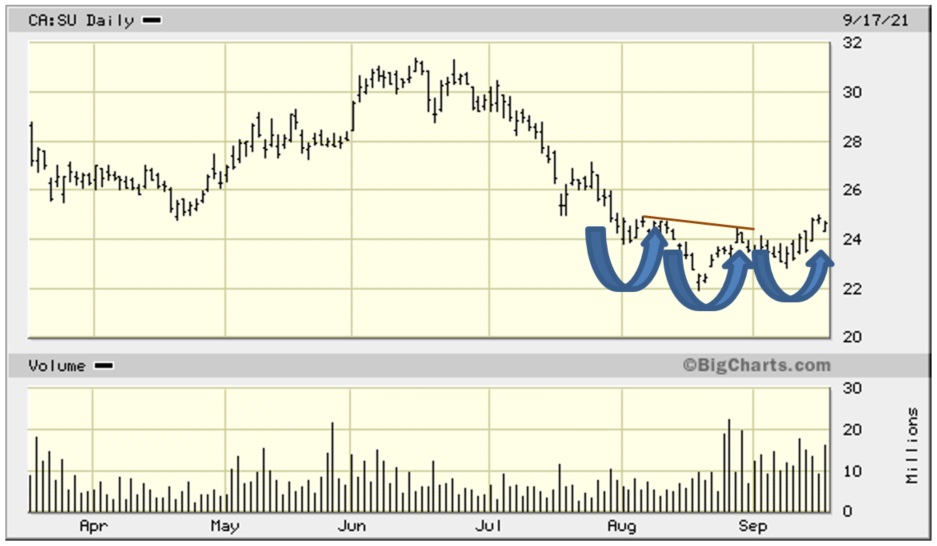
Observation: The six-month chart shows the H&S formation more clearly. The (almost) horizontal BROWN line represents the neckline of the H&S formation. The rule of thumb is that the upwards target is equal to the distance from the bottom of the head to the neckline translated to the neckline upwards. In this case, the distance from the neckline to the bottom of the head is $24.25 – $22 = $2.25. Add that to the neckline, $24.25 + $2.25 = $26.50 as the upwards H&S target. More importantly, a successful completion of the H&S technical formation bodes well for further gains beyond the H&S target.
FIGURE 5: Suncor Six-Month Performance
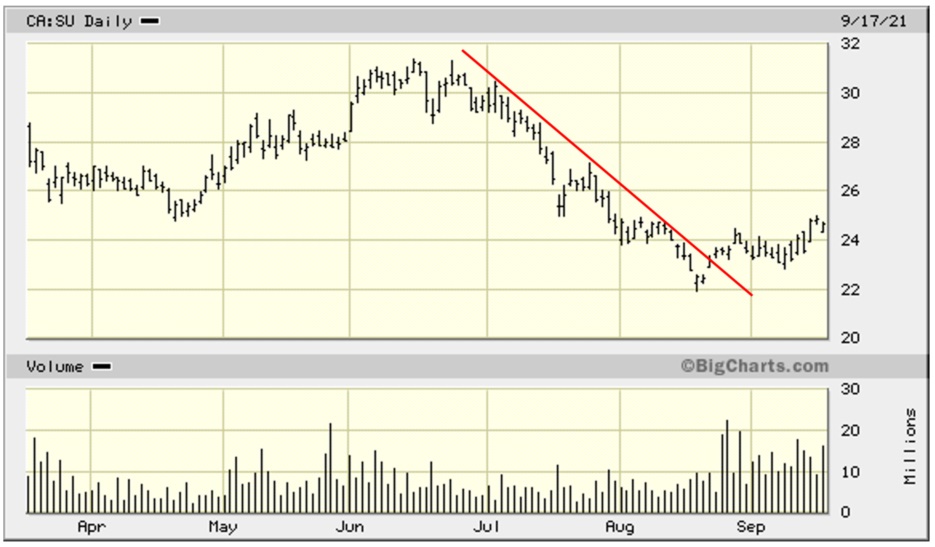
Observation: One final point. The RED down trend-line has been significantly broken to the upside. This positive development also augurs well for further stock gains.
Notes: All numbers in CAD unless otherwise stated. The author of this report, and employees, consultants, and family of eResearch may own stock positions in companies mentioned in this article and may have been paid by a company mentioned in the article or research report. eResearch offers no representations or warranties that any of the information contained in this article is accurate or complete. Articles on eresearch.com are provided for general informational purposes only and do not constitute financial, investment, tax, legal, or accounting advice nor does it constitute an offer or solicitation to buy or sell any securities referred to. Individual circumstances and current events are critical to sound investment planning; anyone wishing to act on this information should consult with a financial advisor. The article may contain “forward-looking statements” within the meaning of applicable securities legislation. Forward-looking statements are based on the opinions and assumptions of the Company’s management as of the date made. They are inherently susceptible to uncertainty and other factors that could cause actual events/results to differ materially from these forward-looking statements. Additional risks and uncertainties, including those that the Company does not know about now or that it currently deems immaterial, may also adversely affect the Company’s business or any investment therein. Any projections given are principally intended for use as objectives and are not intended, and should not be taken, as assurances that the projected results will be obtained by the Company. The assumptions used may not prove to be accurate and a potential decline in the Company’s financial condition or results of operations may negatively impact the value of its securities. Please read eResearch’s full disclaimer.