eResearch | Our Oil Portfolio, in lock step with oil stocks around the world, charged ahead last week as tensions mounted following the assassination of a top Iranian general and the somewhat muted response in the form of some ballistic missiles. The most unfortunate event was the downing of a commercial aircraft, apparently in error. As these tensions dissipated, oil stocks dipped back to pre-crisis levels. By the end of the week, our Portfolio was back to the same level as it was at the end of 2019. At one point, the Portfolio was ahead by 12.1% but ended the week up 8.8%.
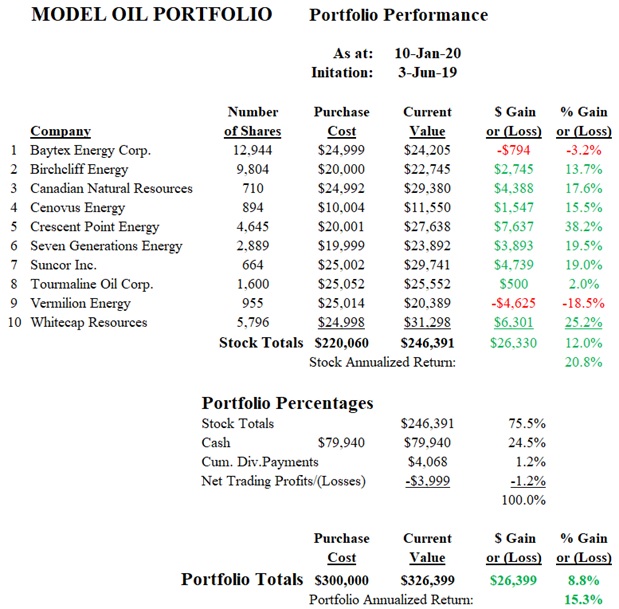
Portfolio Performance
Since inception on June 3, 2019, our Model Oil Portfolio struggled until fairly recently. Its current increase of 8.8%, if annualized, equates to a gain of 15.3% which is not bad if it continues at the same pace for the rest of the year.
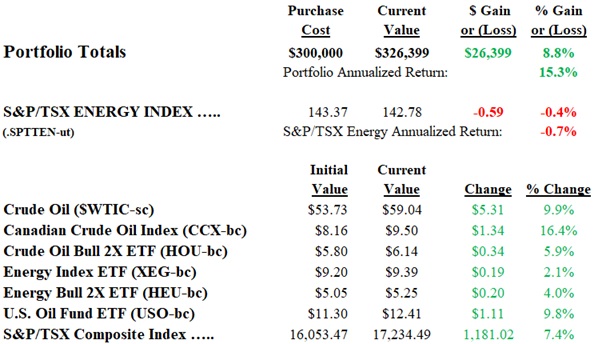
Portfolio Comparison
For comparison, since June 3, the S&P/TSX Energy Index is up 7.4% and the price of crude oil has risen 9.9%. You can check our overall performance in the tables and graphs set out below.
Winners and Losers
Of the 10 stocks in the Portfolio, only 2 are “under water”. Conversely, many of the stocks are above their respective Target Prices. We will review these and revise where appropriate.
Our best-performing stocks since inception are Crescent Point Energy (up 38.2%) and Whitecap Resources (up 25.2%).
Our 2 laggards continue to be Vermilion Energy (down 18.5%), and Baytex Energy (down 3.2%). In our last report, Tourmaline Energy was negative, but it is now ahead by 2.0%.
Cash Position
Cash continues to be a sizable proportion of the Portfolio. We will look for opportunities to utilize some of that cash hoard because there are a few of the holdings, notably Cenovus Energy, whose cost basis is well below the others. Also, we can always add new names to the Portfolio since it is not confined to 10 stocks. However, the maximum single holding on a cost basis cannot exceed $30,000.
INDUSTRY COMPARISON
Next, the return on the portfolio is compared to various energy bench-marks.
The Portfolio since inception is up 8.8%. The S&P/TSX Energy Index is down 0.4%%. The Energy Index Bull 2X ETF (HEU) is up 4.0%. The Energy Index ETF (XEG) is up 2.1%. The price of crude oil is up 9.9% and the Canadian Crude Oil Index (CCX) is up 16.4%.
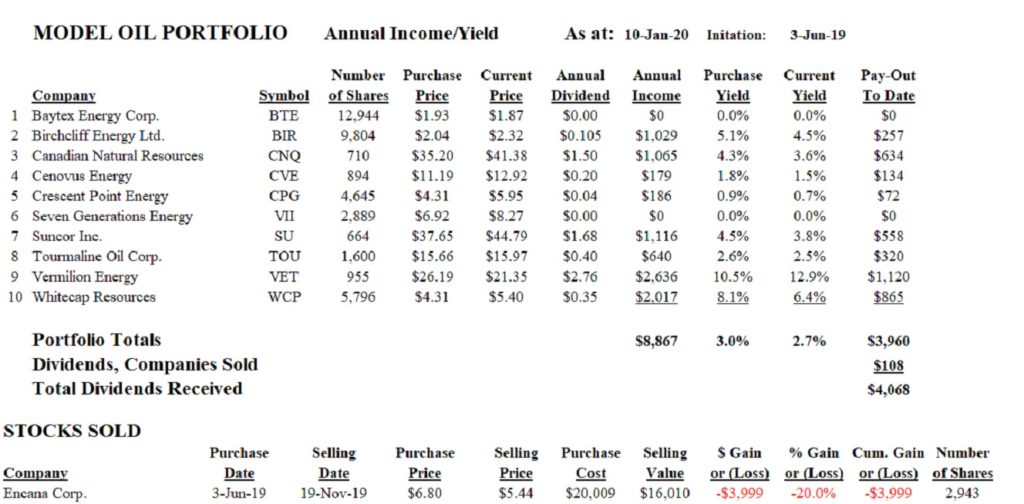
DIVIDENDS and YIELDS
The table below indicates the annual dividend and corresponding annual income and yields.
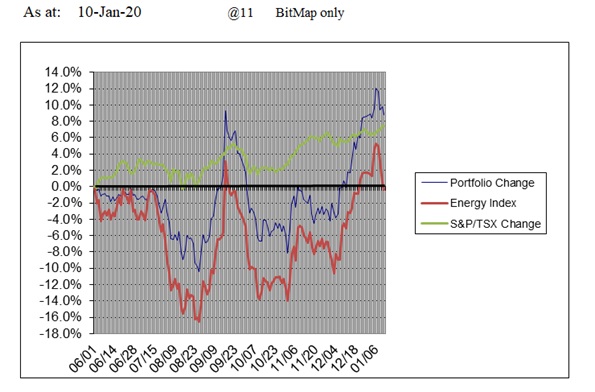
GRAPHIC COMPARISONS
As at: January 10:
Portfolio = +8.8% after dividends and trading losses; +12.0% (stocks only)
S&P/TSX Energy Index = -0.4%
S&P/TSX Composite = +7.4%
//