eResearch | The outlook for the energy sector has improved considerably during December. Positive catalysts include the OPEC+ cartel agreeing to cut oil production in Q1/2020, the successful IPO of Saudi Aramco, and the gain in the price of crude oil, Brent and WTI. Our Model Oil Portfolio gained 6.1% in the last two weeks.
Portfolio Performance – Since December 6, Past 2 Weeks and Since Inception
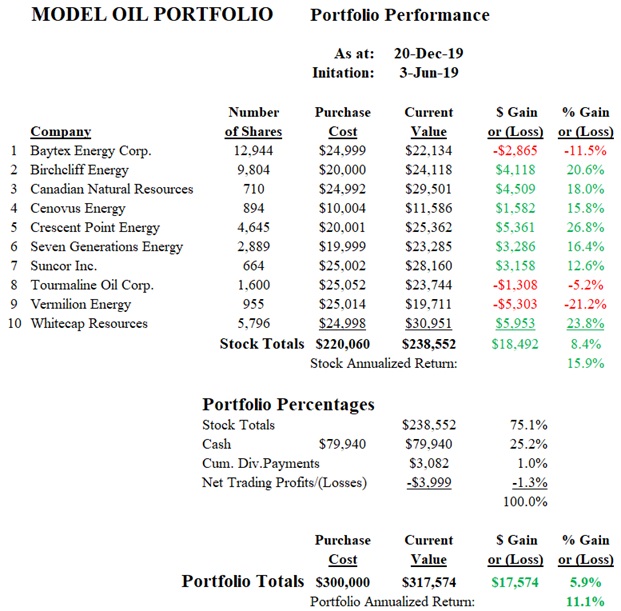
In our last update, priced on December 6, the value of the Oil Portfolio was just under $300,000, at $299,307. The current value is now $317,574, a gain over the last two weeks of 6.1%. The Portfolio is up 5.9% since inception. For comparison, the S&P/TSX Energy Index over the last two weeks increased 5.4% and the price of crude oil rose 2.3%. You can check our overall performance in the tables and graphs set out below.
Portfolio Changes
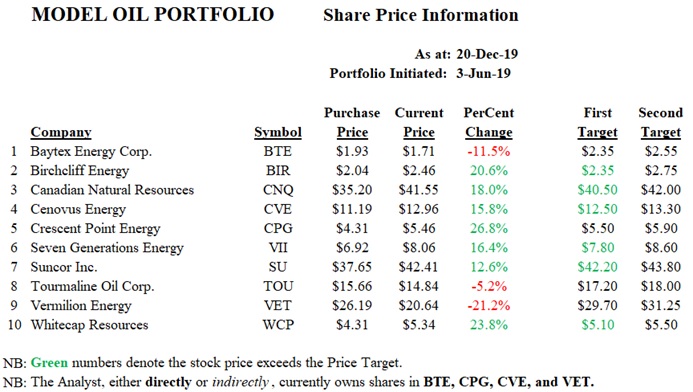
There were no changes made to the composition or share-holdings of the Portfolio in the last two weeks. However, we raised the Target Prices of several of the stocks since they had substantially exceeded their original price objectives.
Winners and Losers
There is no change in the number of winners/losers in the Portfolio in the last two weeks. Of the 10 stocks in the Portfolio, currently 7 are in the Green and 3 are in the Red.
There was a change in the three best-performing stocks over the last two weeks and, now, Crescent Point Energy (up 26.8%), Whitecap Resources (up 23.8%), and Birchcliff Energy (up 20.6%) lead the group. The same three laggards, but less so, are Vermilion Energy (down 21.2%), Baytex Energy (down 11.5%), and Tourmaline Energy (off 5.2%).
Cash Position
We continue to hold a sizable cash position, currently 25% of the Total Portfolio.
Outlook
An increasing number of market pundits are extolling the virtues of the energy sector as a probable top performer in 2020. Certainly the worst is likely behind the sector. However, the positive seasonality time-frame for oil comes to an end at the end of December. Still, we continue to believe that the energy stocks will slowly grind higher in the weeks and months ahead. Thus, we believe there will likely be some rich rewards for the patient investor.
Portfolio Performance Since June 3, 2019
The following table shows how the Portfolio has performed since inception on June 3, 2019.
INDUSTRY COMPARISON
Next, the return on the portfolio is compared to various energy bench-marks.
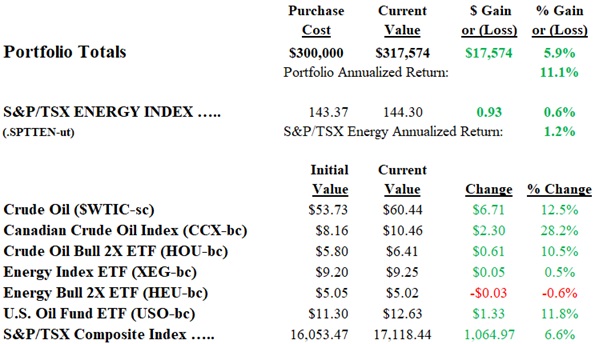
The Portfolio since inception is up 5.9%. The S&P/TSX Energy Index is up 0.6%. The Energy Index Bull 2X ETF (HEU) is down 0.6%. The Energy Index ETF (XEG) is up 0.5%. The price of crude oil is up 12.5% and the Canadian Crude Oil Index (CCX) is up a significant 28.2%.
DIVIDENDS & YIELDS
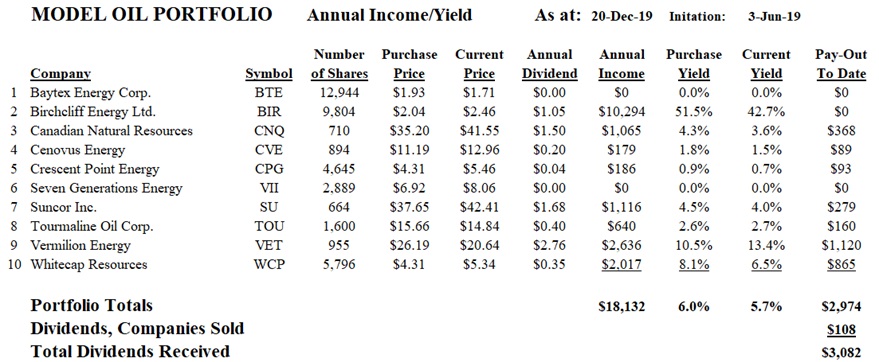
The table below indicates the annual dividend and corresponding annual income and yields. This table is updated twice monthly or when a stock is bought or sold.

Source: eResearch.com
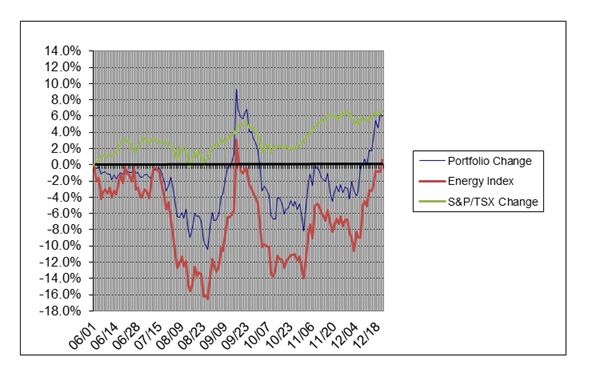
GRAPHIC COMPARISONS
As at: December 20
eResearch Model Oil Portfolio = +5.9% after dividends and trading losses; +8.4% (stocks only)
S&P/TSX Energy Index = +0.6%
S&P/TSX Composite = +6.6%
//