eResearch | The outlook for the energy sector, and particularly for the oil component, was given a boost on Friday as the OPEC+ cartel agreed to cut oil production in Q1/2020. Our Portfolio continues to perform relatively well but is still struggling to gain traction in positive territory.
Portfolio Performance
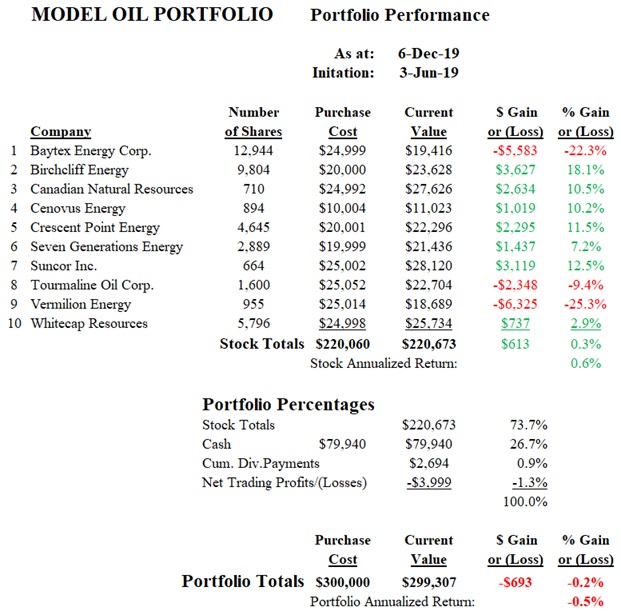
The value of the Oil Portfolio at our last update on November 7 was $300,143. As at December 6, one month later, the value is $299,307, a virtual stand-still. The S&P/TSX Energy Index likewise is essentially unchanged over the same time-frame. The price of crude oil is only marginally higher in the last month and most of the gain was attained in the last two trading days. Since inception at the beginning of June, the current stock portion is marginally higher with a gain of 0.3% but, after taking into account our only trading transaction, a loss, the overall Portfolio is down 0.2%. The S&P/TSX Energy Index is off 4.8% since the beginning of June.
Portfolio Changes
We recently added to our position in Crescent Point Energy, doubling our holding to the $20,000 level. It is one of our best performers.
Winners and Losers
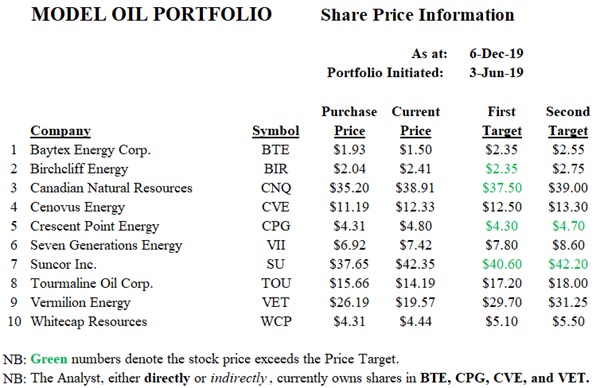
Of the 10 stocks in the Portfolio, currently 7 are in the Green and 3 are in the Red.
The best-performing stocks are Birchcliff Energy (up 18.1%), Suncor (up 12.5%), and Crescent Point Energy (up 11.5%). The three laggards are Vermilion Energy (down 25.3%), Baytex Energy (down 22.3%), and Tourmaline Energy (off 9.4%). Those first two losers are having a major negative impact on the Portfolio and retarding what otherwise has been a respectable performance by the winners. Two of the winners are above both our First and Second Targets.
Cash Position
Even after the Crescent Energy purchase, we continue to hold a sizable cash position, currently 27% of the Total Portfolio.
Outlook
The recent decisions by OPEC+, and Saudi Arabia in particular, to cut production in Q1/2020 provided some heft to the price of crude on Friday. From a seasonality standpoint, we are still in a positive time-frame for oil although this comes to an end at the end of December. Nevertheless, we continue to believe that the worst is over for the energy sector and that brighter days lie ahead. What remains uncertain is just when these last remaining clouds are going to roll away and leave us with a sunny outlook. It could occur sooner than later but, for now, a slow grind higher seems most likely. So, ahead, we believe there will likely be some rich rewards for the patient investor.
Portfolio Returns
The following table shows how the Portfolio has performed since inception on June 3, 2019.
Industry Comparison
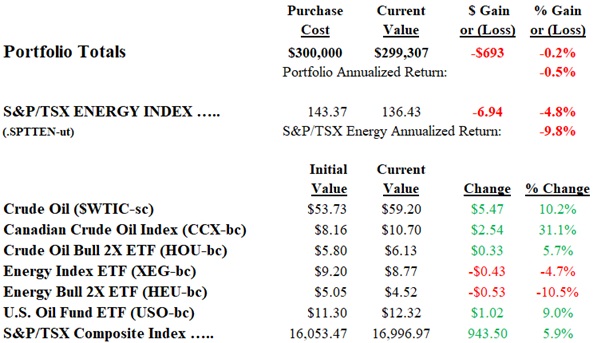
Next, the return on the portfolio is compared to various energy bench-marks.
The Portfolio since inception is essentially flat, down just 0.2%. The S&P/TSX Energy Index is off 4.8%. The Energy Index Bull 2X ETF (HEU) is down 10.5% and the Energy Index ETF (XEG) is down 4.7%. The price of crude oil is up 10.2% and the Canadian Crude Oil Index (CCX) is up a significant 31.1%.
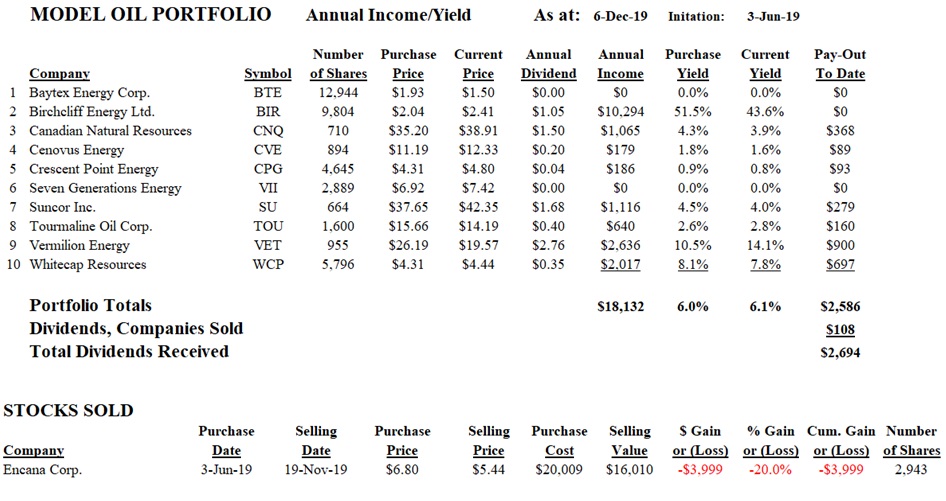
Dividends and Yields
The table below indicates the annual dividend and corresponding annual income and yields. This table is updated twice monthly or when a stock is bought or sold.
//