eResearch | TransAlta Renewables Inc. (TSX: RNW) is a Canadian-based company that owns a portfolio of renewable and natural gas power generation facilities and other infrastructure assets.
The Company has interests in approximately 23 wind facilities, 13 hydroelectric facilities, 7 natural gas generation facilities, one solar facility, one natural gas pipeline, and one battery storage project, and representing an ownership interest of over 2,537 megawatts of owned generating capacity, located in the provinces of British Columbia, Alberta, Ontario, Quebec, New Brunswick, the states of Wyoming, Massachusetts, and Minnesota, and the State of Western Australia.
Its facilities include South Hedland Power Station, Southern Cross, Sarnia, Parkeston, Fortescue River Gas Pipeline, Akolkolex, Appleton, Bone Creek, Galetta, Moose Rapids, Taylor Hydro, Waterton, Big Level, Le Nordais, New Richmond, Summerview 1, Wolfe Island and Kent Hills.
Current Market Data
- Current Price (Feb. 10): C$17.07
- 52-Week High Low: $22.55 – $16.01
- Decline from High Price: 24%
- Monthly/Annual Dividend: $0.78333/$0.94
- Dividend Coverage (9 months to Sept.30): 0.98x
- Current Yield: 5.5%
- Shares O/S: 266.86 million
- Market Cap: C$4.56 billion
Problems at Kent Hills
In mid-January 2022, the Company was forced to shut down its New Brunswick-based Kent Hills 1 and 2 wind turbines after a tower collapse at Kent Hills 2 because of weak foundational structure and, now, all 50 wind turbines at Kent Hills 1 and 2 require complete foundation replacement. The estimated cost is $75M – $100M and could take until the end of 2023 before all are back online. In the meantime, the Company will bleed lost revenue of about $3.4M per month as long as all 50 turbines are off-line. The Company expects to bring turbines back online as the foundation replacements are completed.
In the meantime, the Company could be in violation of its bond covenants associated with the financing for Kent Hills. This undoubtedly has negatively affected the Company’s share price. Successfully resolving this issue would be a positive for the company and its shares.
Possible New Off-Take Contract
The Company is negotiating a possible new off-take contract with the large Australian iron ore company, Fortescue Metals Group, in relation to the Company’s South Hedland power station facility in Western Australia. The two companies already have a working relationship.
Nine Months Results
Nine Months to: Sept 30/21 Sept 30/20
Renewable Energy Production (GWh) 3,013 3,135
Revenue ($C, millions) 332 308
Cash Flow ($C, millions) 265 218
Earnings ($C, millions) 97 39
E.P.S. ($) 0.97 0.39
Available Cash Per Share ($) 0.69 0.87
Dividends Per Share ($) 0.705 0.705
Monthly Dividend ($) 0.78333 0.78333
Annual Dividend ($) 0.94 0.94
Dividend Coverage (times) 0.98x 1.23x
FIGURE 1: Five-Year Chart
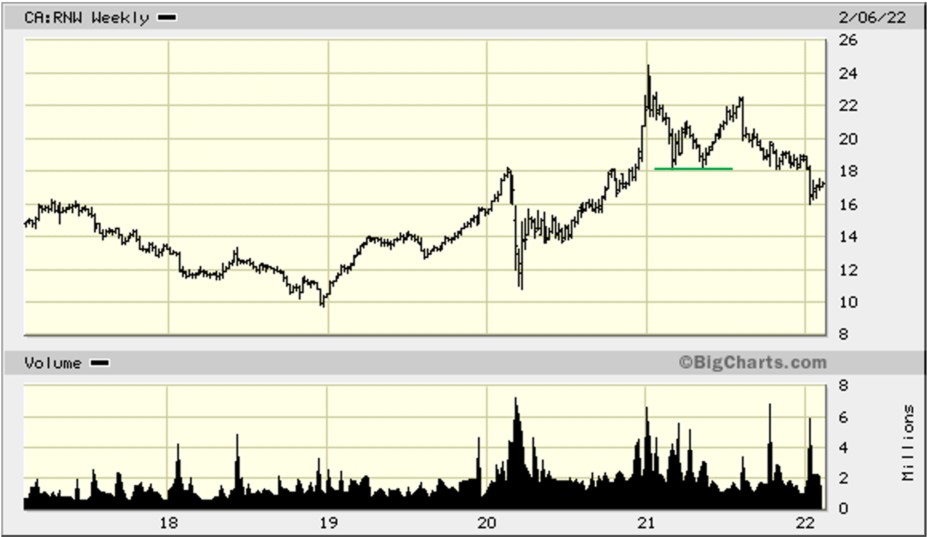
Observations: RNW’s five-year chart shows the investor interest for renewables that began at the beginning of 2019 when the stock traded for C$10 per share. The stock reached a high of $24.47 on January 7, 2021. That high-water mark has not been challenged since and represents a significant Resistance level. From that point, for the next half-year, the stock formed a “W” technical pattern, also known as a Double Bottom (GREEN line). Normally, W formations occur after a decline in the share price and herald the prospects for recovery. In this instance, the W pattern occurred right after the stock reached its all-time high, and nullified the usual W formation aftermath. The stock found support at the Double Bottom at $18 until the end of 2021, then collapsed to $16 with the negative announcement concerning Kent Hills.
FIGURE 2: Two-Year Chart
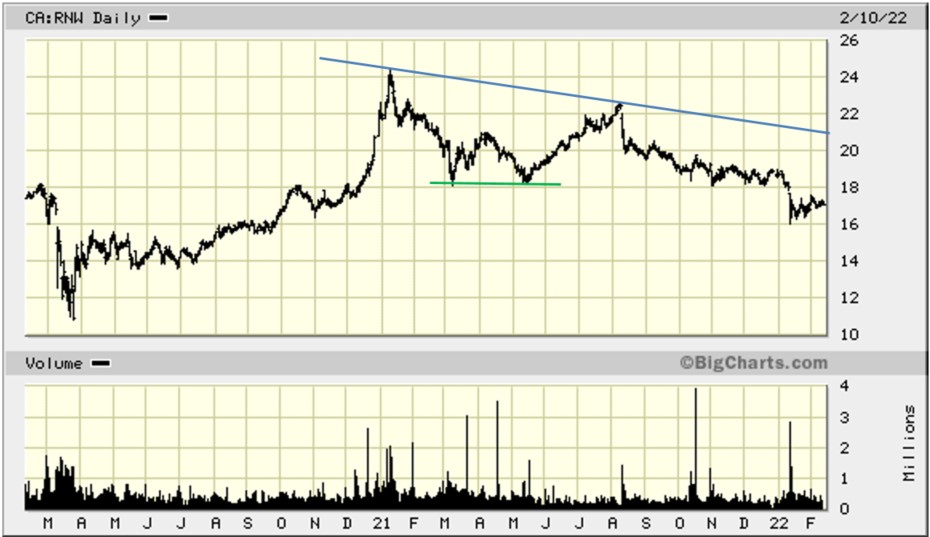
Observations: The two-year chart shows the Double Bottom clearly and the longer-term Down-Trend (BLUE) line. There has been a slight recovery off of the $16 Support price since the beginning of 2022.
FIGURE 3: One-Year Chart
Observations: In the one-year chart above, we have included the Double Bottom GREEN Support line and the longer-term BLUE Down-Trend line. In our next chart, covering six months, we show additional technical points, including the shorter-term Down-Trend RUST line
FIGURE 4: Six-Month Chart
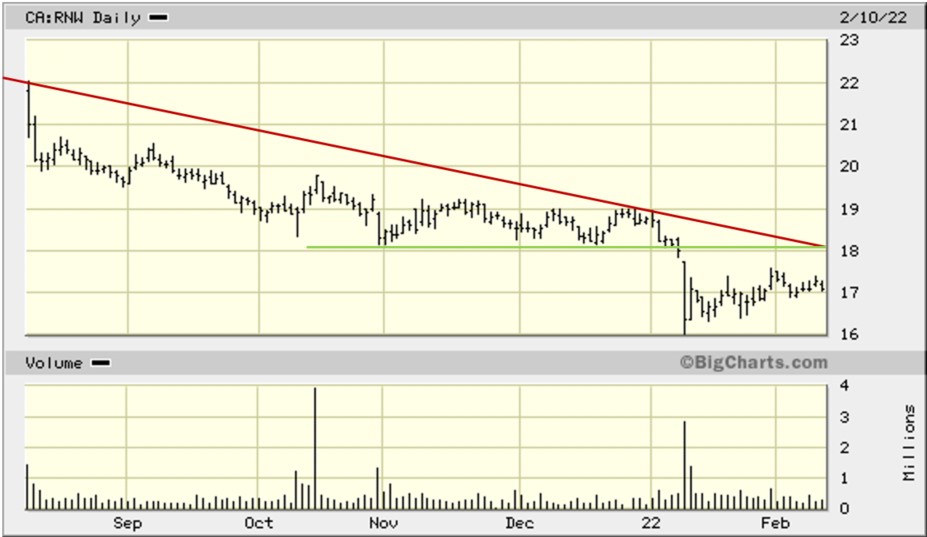
Observations: The six-month chart shows a shorter-term Down-Trend RUST line that starts at the beginning of August. It currently intersects at $18, notable for being the Double Bottom Support line, which we have extended horizontally from the Double Bottom formation and depicted by the LIGHT GREEN line.
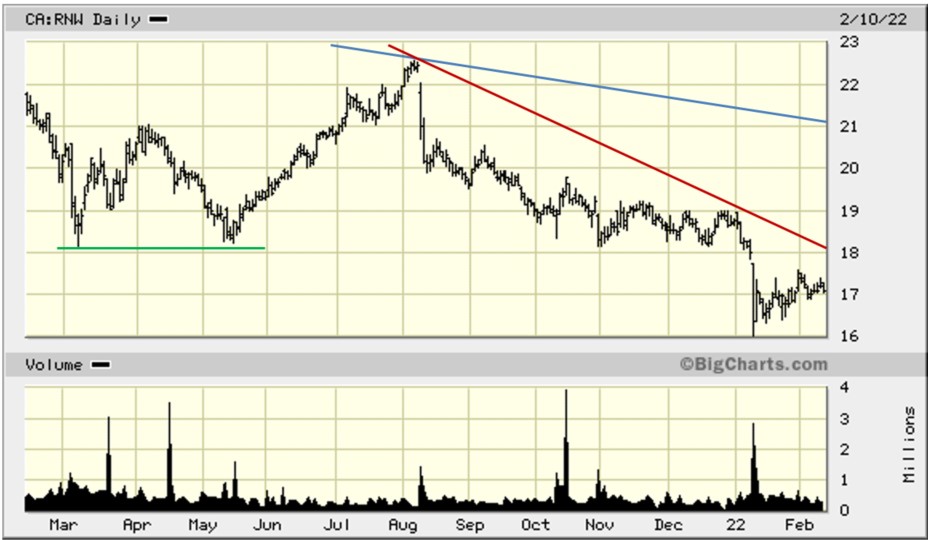
FIGURE 5: Three-Month Chart
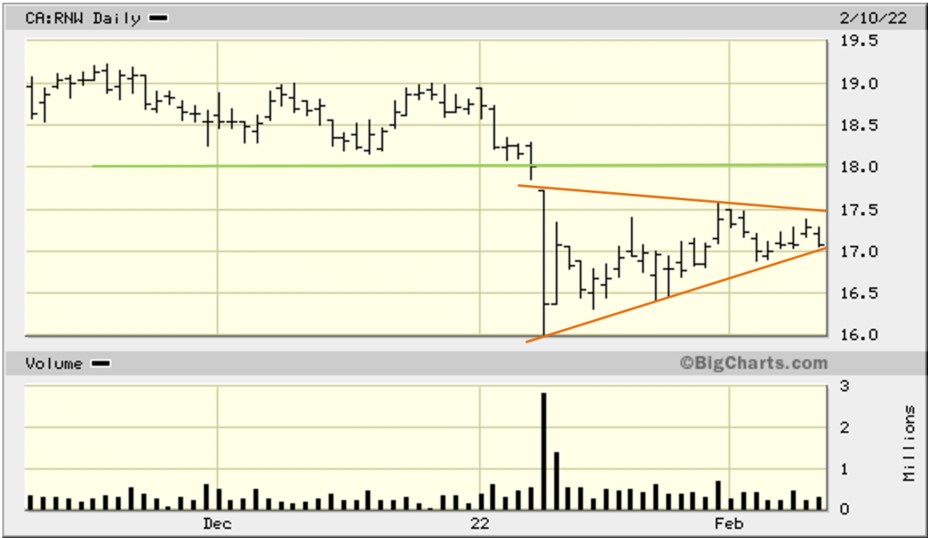
Observations: Now we are into short-term technical considerations. The LIGHT GREEN Support-turned-Resistance line sits at $18. This is a strong Resistance line and may take a few runs at it to overcome. In the meantime, the stock is currently enveloped by a rising Triangle, defined by the ORANGE lines. The stock NEEDS to break out on top of the triangle, otherwise, a break-down below the triangle would indicate further weakness is in store. How much weakness? We have to go back to Figure 2 for the answer. The first Support is at $16, the recent low. If that does not hold, there is good resistance just below $14 (April – July 2020). After that, a test of the March 2020 low of around $11 is a possibility.
On the upside, once the stock has broken clear of the $18 Resistance level, the next upwards target is the longer-term Down-Trend line at $21. Above that is an intermediate high just above $22, and then the all-time high at $24.47.
Notes: All numbers in CAD unless otherwise stated. The author of this report, and employees, consultants, and family of eResearch may own stock positions in companies mentioned in this article and may have been paid by a company mentioned in the article or research report. eResearch offers no representations or warranties that any of the information contained in this article is accurate or complete. Articles on eresearch.com are provided for general informational purposes only and do not constitute financial, investment, tax, legal, or accounting advice nor does it constitute an offer or solicitation to buy or sell any securities referred to. Individual circumstances and current events are critical to sound investment planning; anyone wishing to act on this information should consult with a financial advisor. The article may contain “forward-looking statements” within the meaning of applicable securities legislation. Forward-looking statements are based on the opinions and assumptions of the Company’s management as of the date made. They are inherently susceptible to uncertainty and other factors that could cause actual events/results to differ materially from these forward-looking statements. Additional risks and uncertainties, including those that the Company does not know about now or that it currently deems immaterial, may also adversely affect the Company’s business or any investment therein. Any projections given are principally intended for use as objectives and are not intended, and should not be taken, as assurances that the projected results will be obtained by the Company. The assumptions used may not prove to be accurate and a potential decline in the Company’s financial condition or results of operations may negatively impact the value of its securities. Please read eResearch’s full disclaimer.