eResearch | Our last article (Friday, February 28) from Scott Grannis, the Calafia Beach Pundit, was propitious. It was entitled “Interest Rates and the Fed: Is A 50 bps Cut Coming?” On the following Tuesday, March 3, the Fed did just that … a 50 basis point reduction in baseline interest rates in the USA.
We have long admired the Calafia Beach Pundit as a solid, insightful economist. It is gratifying to be able to provide plaudits when richly deserved. Good call, Scott!!!
This week, the Calafia Beach Pundit zeroes in on Market Crashes for his commentary.
He begins by reminiscing on the October 1987 market crash. In a two-month period, the market lost more than one-third of its value. This past Monday, the market opened down about 20%.
Usually, market drops of this magnitude herald an impending Economic Recession. But this did not happen in 1987. In fact, GDP increased around 7% in Q4/1987.
Now, we have the prospect of an ugly virus possibly very negatively impacting global economies. The world today is so economically inter-related that problems in any one important world economy reverberate around the globe.
In 1987, it certainly looked likely that the USA would fall into recession, and it certainly looks that way today. It did not happen then, but will it happen now?
(As an aside, eResearch just published its latest Recession Barometer report, now on our website. Last week, despite plunging interest rates, yield curve spreads actually widened. The latest “reading” is 6.5x, down from 7.5x a week ago, and 8.5x two weeks ago. This reading is well off 10.0x where recessionary fears are galvanized.)
While virus researchers frantically seek a vaccine cure, the stock market gets on with its business. Ample liquidity is a key component of a viable, thriving stock market environment and, at the present time, there is no evidence that market liquidity is drying up. Central banks are providing that liquidity and the prospect of the reintroduction of Quantitative Easing seems likely (at this point).
Scott Grannis provides six charts in this article: (1) Stocks Climb Walls of Worry; (2) 3-Month T-Bill Yields; (3) 5-Year CDS Spreads; (4) 2-Year Swap Spreads; (5) Dollar versus Crude Oil; and (6) the VIX Chart.
With the price of crude oil now glaringly in the news, here is that Dollar versus Crude Oil chart:
Chart 1: US Dollar vs Crude Oil
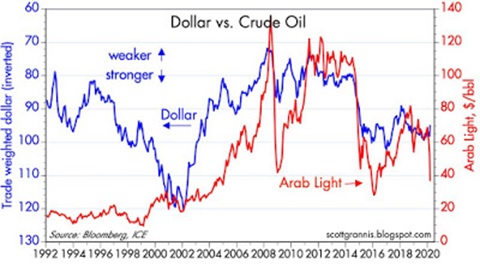
The U.S. Dollar is currently trading close to its longer-term average, and is neither excessively weak nor over-optimistically strong. Crude oil, on the other hand, has declined significantly of late. Although this is good for consumers, it is not good for the producers.
Latest Report
You can read the entire Calafia Beach Pundit report with its accompanying 6 charts by clicking: Market Crash Thoughts
//