eResearch | We track 12 Canadian sector ETFs and 12 U.S. sector ETFs. What we will highlight in these ETF reports is to compare and contrast the performance of selected Canadian and U.S. ETF sectors. In this report, we have chosen to analyze the Energy Sector ETFs. There are many similarities, but also some surprising differences. This allows the opportunity to try to understand why, which then opens up opportunities to benefit from the discrepancies.
Sector Analysis: Focus On Energy
The Energy Sector has, far and away, been the best-performing market sector in 2022 to date. From the start of the year, up to and including March 4, the Canadian Energy ETF, TSX: XEG, has risen 33.2%. The corresponding U.S. Energy ETF, NYSE: XLE, has gained an even higher 35.5%.
Figure 1: XEG Versus XLE
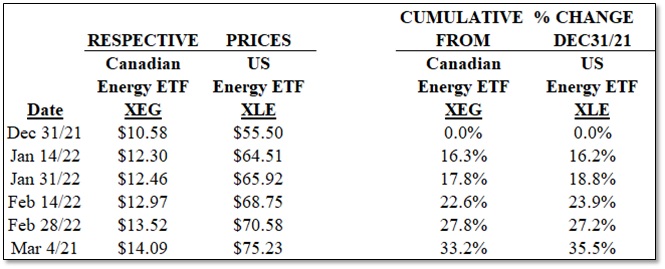
Not much to go on here when considering the respective ETFs alone. However, these ETFs reflect the underlying strength of the stocks of the entire Energy Sector in both countries and their outstanding performance since the beginning of the year. Representative Canadian and U.S. energy companies are presented in Figure 2 below.
Figure 2: Representative Canadian and U.S. Oil Companies Stock Performance 2022 To Date
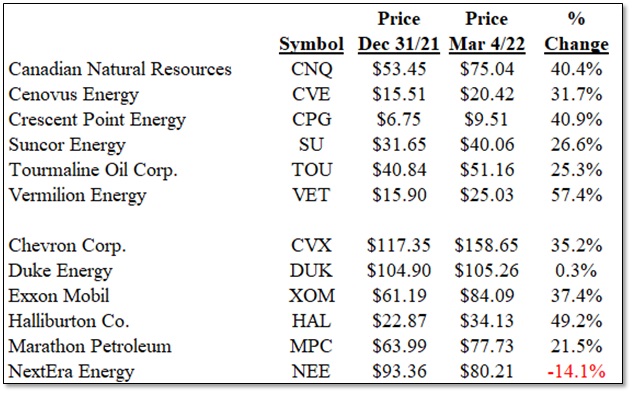
The above is only a representative list and does not reflect many other companies that are included in the composition of each of the Energy Sector ETF.
But, let us go back and look at what transpired in 2021.
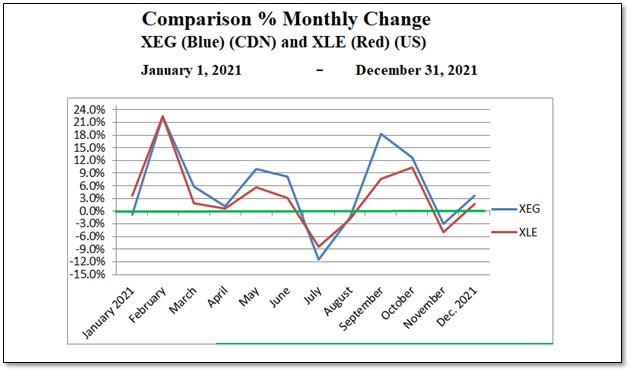
First, the end-of-month prices for both ETFs (left columns) and also the monthly percentage changes (right columns). We show the information in both tabular and chart forms.
Figure 3: Table of XEG and XLE 2021 End-of-Month Prices and Monthly Percentage Changes
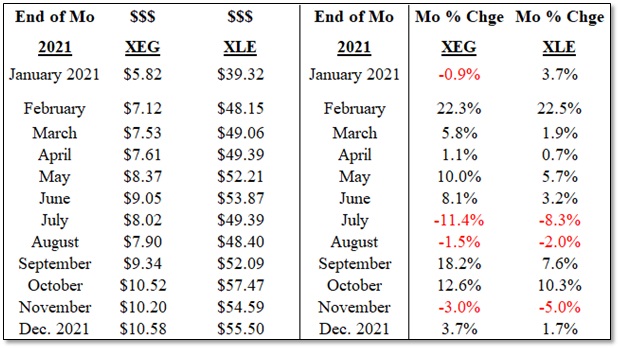
Figure 4: Chart of XEG and XLE 2021 End-of-Month Prices and Monthly Percentage Changes
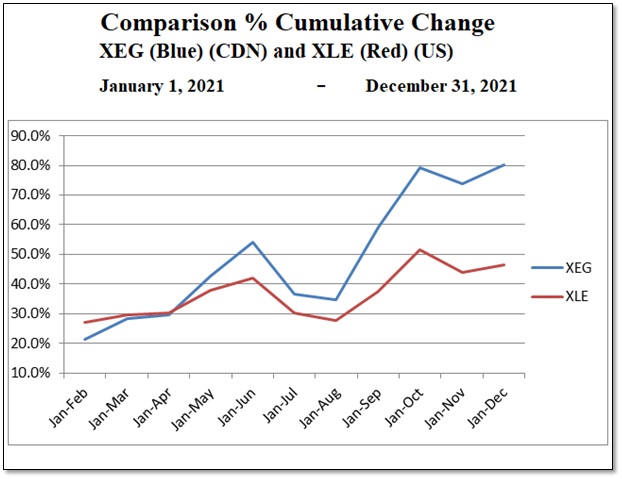
Next, we have the cumulative monthly changes in these two ETFs. Here is where there is a surprising difference. The Canadian XEG ETF did so much better than its U.S. counterpart, XLE.
Figure 5: Table of XEG and XLE 2021 Cumulative Monthly Changes
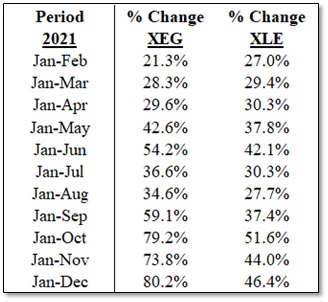
Figure 6: Chart of XEG and XLE 2021 Cumulative Monthly Changes
Conclusion: The take-away from this comparison is that ETFs can provide substantial returns. However, caution is warranted as ETFs can be very volatile. Witness the wide swings in the Monthly Changes in both XEG and XLE that are illustrated in Figure 3.
Also, as we intend to show in future reports on ETFs, they can also produce significant negative returns. In fact, to date in 2021, on the Canadian exchange, 5 of the sectors are showing positive returns between 1.1% (Financials) and 33.2% (Energy), and 7 sectors are in negative territory between -0.1% (Utilities) and -25.2% (Technology). On the major U.S. exchange, 3 sectors are positive between 7.4% (Global Gold) and 35.5% (Energy), and 9 sectors are negative between -1.0% (Utilities) and -16.1% (Consumers Discretionary).
Notes: All numbers in CAD unless otherwise stated. The author of this report, and employees, consultants, and family of eResearch may own stock positions in companies mentioned in this article and may have been paid by a company mentioned in the article or research report. eResearch offers no representations or warranties that any of the information contained in this article is accurate or complete. Articles on eresearch.com are provided for general informational purposes only and do not constitute financial, investment, tax, legal, or accounting advice nor does it constitute an offer or solicitation to buy or sell any securities referred to. Individual circumstances and current events are critical to sound investment planning; anyone wishing to act on this information should consult with a financial advisor. The article may contain “forward-looking statements” within the meaning of applicable securities legislation. Forward-looking statements are based on the opinions and assumptions of the Company’s management as of the date made. They are inherently susceptible to uncertainty and other factors that could cause actual events/results to differ materially from these forward-looking statements. Additional risks and uncertainties, including those that the Company does not know about now or that it currently deems immaterial, may also adversely affect the Company’s business or any investment therein. Any projections given are principally intended for use as objectives and are not intended, and should not be taken, as assurances that the projected results will be obtained by the Company. The assumptions used may not prove to be accurate and a potential decline in the Company’s financial condition or results of operations may negatively impact the value of its securities. Please read eResearch’s full disclaimer.