eResearch | Yea! We have reached October, traditionally one of the best months of the year for stock market performance. We have also left behind one of the worst months of the year for stock performance. Historically, from the beginning of May through to the end of September, the market usually languishes, with September often the most notable.
Of course, you sold all of your stocks on September 1! So, now, you can buy them all back again.
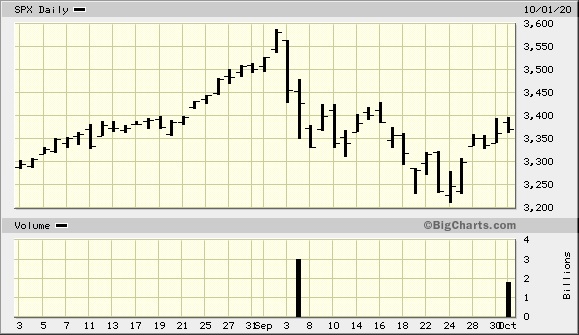
Here is the two-month chart for the S&P 500 Index. August was up. September was volatile and down.
CHART 1: S&P 500 Index
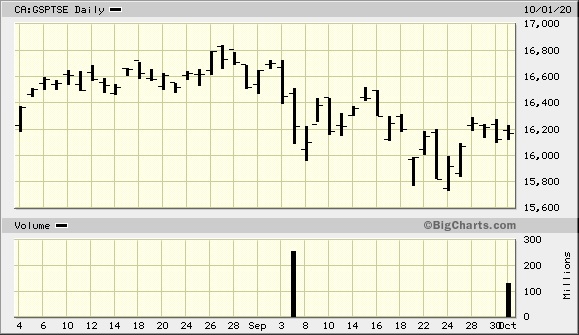
Here is the two-month chart for the S&P/TSX Composite Index. Again, August was up, but September proved to be pretty choppy and generally down.
CHART 2: S&P/TSX
In last month’s report, we postulated that the long-awaited stock market pull-back might have finally arrived, as September 3rd and 4th saw considerable market declines. There was, indeed, a pull-back in September, but not nearly as dramatic as we feared it could have been.
The following table shows the actual September performance for four key market indexes.
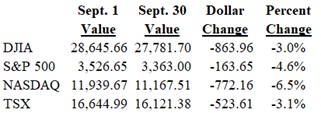
The NASDAQ declined the most, at 6.5%, as the major tech stocks faced some reckoning. The broad market, represented by the S&P 500 Index, dropped 4.6%. The DJIA and the Toronto Composite Index were down only about 3%.
Looking ahead, on balance, the S&P 500 Index has gained 1.2%, on average, in October with a positive occurrence rate of 65% of the time.
On that optimistic note, let us look at the myriad of indexes and market sectors that come back into positive seasonality expectations in October.
Seasonal Trends for the Market Segments in October
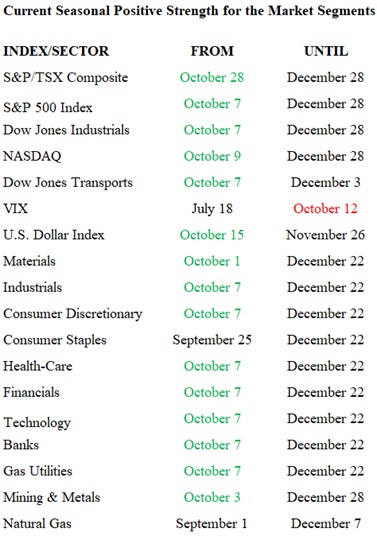
The following table shows which indexes and sectors are “in season” during the month of October. There are 15 additions this month, shown in GREEN under FROM, including 5 major stock indexes and 10 market sectors. There is but one expiry this month and shown in RED under UNTIL.
NOTE: A full seasonality list of indexes and sectors is provided at the end of this report.
The market indexes and market sectors added to the seasonality mix in October are S&P/TSX Composite Index, S&P 500 Index, Dow Jones Industrials, NASDAQ, Dow Jones Transports, U.S. Dollar Index, Materials, Industrials, Consumer Discretionary, Health-Care, Financial, Technology, Banks, Gas Utilities, and Metals & Mining. The only sector which ends its seasonal strength in October is the VIX.
Importance of Seasonality Trends
Utilizing the market’s historical seasonality trends can provide a useful framework for assessing and then altering the mix of one’s stock portfolio. Highly volatile markets often open up exceptional opportunities for astute investors to take advantage of market weakness to buy quality stocks that have declined in price significantly in line with the overall market downdraft. As a result, market sectors that are “in season” often provide exceptional stock-buying opportunities in such dire market conditions.
Seasonality refers to particular time-frames when stocks/sectors/indexes are subjected to and influenced by recurring tendencies that produce patterns that are apparent in the investment valuation process. A seasonality study preferably uses at least 10 years of data. Our data (courtesy of Equity Clock) is for 14 years.
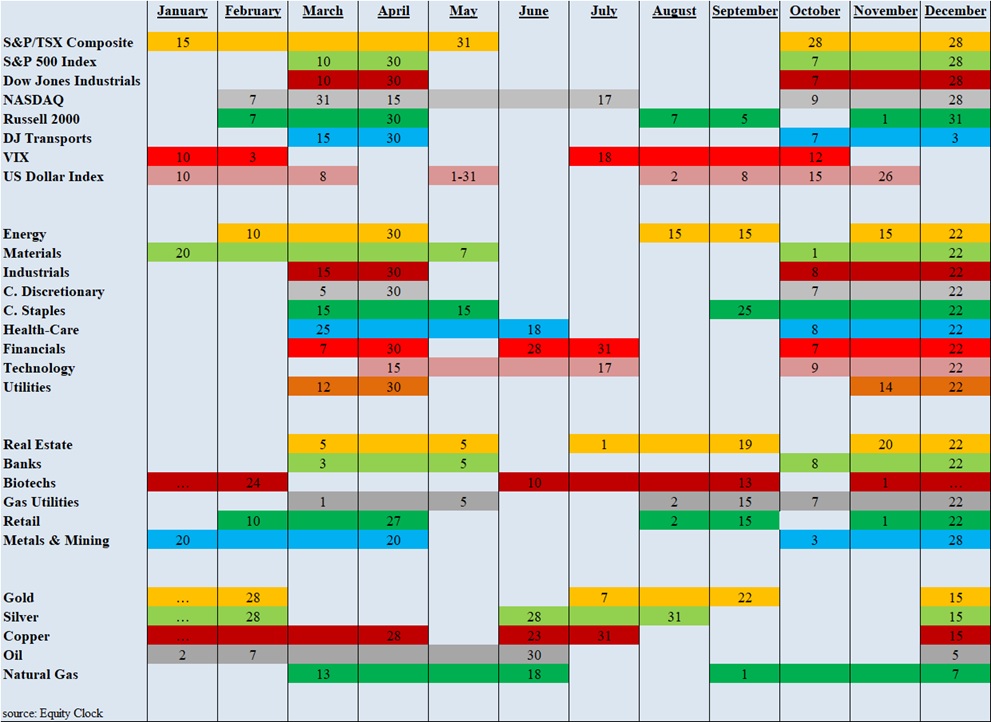
Seasonality Trends Chart
The Seasonality trends chart is an ever-changing 14-year average of the indexes and sub-indexes that we track. The charts are courtesy of www.equityclock.com.
The Seasonality Trends chart below has been updated as of May 2020. It shows the periods of seasonal strength for 28 market segments (sectors/indexes). Each bar indicates a buy and a sell date based upon the optimal holding period for each market sector/index.
//