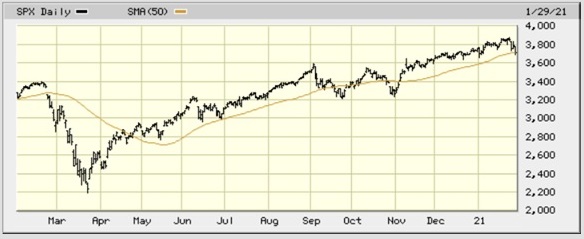
eResearch | Ominous!? The S&P 500 Index has just broken below its 50-Day Moving Average!
Reviewing the chart below, there were three previous cross-overs of the SPX with the 50-MA in the last twelve months. The first one, in February, was dramatic as it corresponded to the market melt-down associated with the COVID-19 realization that a pandemic was at hand. The other two break-downs, in September and October, although they heralded further declines in the SPX at the time, were brief, and the market recovered, with the October incident going on to new all-time highs.
What will happen this time? This bears close watching.
Changes for February
There are 6 additions in February to the seasonality mix while, over the ensuing four weeks, there are 4 sectors that reach the end of their seasonality strength.
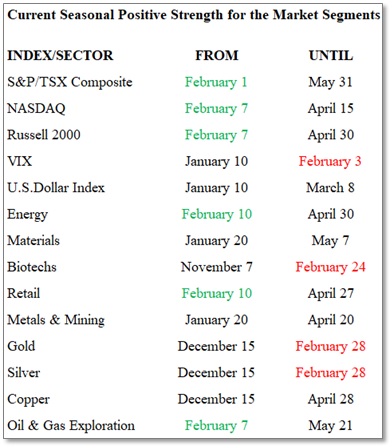
Seasonal Trends for the Market Segments in February
The following table shows which indexes and sectors are “in season” during the month of February. There are six additions this month, shown in GREEN under FROM, and four expiries this month, shown in RED under UNTIL
NOTE: A full seasonality list of indexes and sectors is provided at the end of this report.
The market sectors added to the seasonality mix in February are the S&P/TSX Composite Index, the NASDAQ, the Russell 2000, Energy, Retail, and the return of the Oil & Gas Exploration sector.
Importance of Seasonality Trends
Seasonality refers to particular time-frames when stocks/sectors/indexes are subjected to and influenced by recurring tendencies that produce patterns that are apparent in the investment valuation process. A seasonality study preferably uses at least 10 years of data.
Seasonality Trends Chart
The Seasonality Trends chart below was updated in December 2020. The chart shows the periods of seasonal strength for 28 market segments (sectors/indexes). Each bar indicates a buy and a sell date based upon the optimal holding period for each market sector/index.
The Seasonality trends chart is an ever-changing 14-year average of the indexes and sub-indexes that we track. The information in the chart is courtesy of www.equityclock.com.

Notes: All numbers in USD unless otherwise stated. The author of this report, and employees, consultants, and family of eResearch may own stock positions in companies mentioned in this article.