eResearch | The well-recognized, widely-followed adage “Sell in May, and Go Away” certainly will not apply this year.
Global stock markets have been turned upside down by COVID-19. The coronavirus has successfully ended the longest bull market in U.S. history. It was fun while it lasted. Then the bottom fell out, literally.
From mid-February until mid-March, just 4 weeks of trading, the Dow Jones Industrial Average dropped 11,355 points, from 29,569 to 18,214, 0r 38.4%. The S&P/TSX Composite Index collapsed from 17,970 to 11,173, a total of 6,797 points, or 37.8%. The S&P 500 Index fell 1,202 points from 3,394 to 2,192, or 35.4%. Other global indexes recorded similar declines.
Then came a sharp recovery, the classic V-formation. But it did not last long, and it was not as sharp as the fall. The recovery is still ongoing, but it is labouring as opposed to the dramatic decline.
It is difficult to foresee the indexes returning to their all-time highs any time soon, given the horrendous next few quarters of corporate earnings declines. Plus, most of the major economies of the world will have entered recession (two successive quarters of GDP decline) with Q2/2020. GDP growth for the next few quarters is not likely to be sanguine, and that is stating it mildly.
In fact, perhaps a greater fear is the possibility of a global depression (an annual decline in GDP exceeding 10%; such decline is calculated on a running twelve-month basis). Let that sink in: a global depression!
Nonetheless, there will always be opportunities for the astute investor. After all, indexes are general in nature. They cannot take into account individual situations. Using seasonality trends is still a useful investing tool as part of one’s investment strategy.
So, what sectors are in trend right now?
Seasonal Positive Strength for the Market Segments in May
The following table shows which indexes and sectors are “in season” during the month of May. The date (just one) in GREEN under FROM is this month’s addition, and the seven in RED under UNTIL are this month’s expiries.
(A full list of indexes and sectors is provided at the end of this report.)
TABLE 1: Current Seasonal Positive Strength for the Market Segments Changing this Month
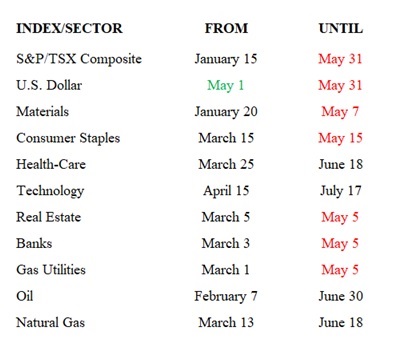
Changes for May
There is one sector added to the seasonality mix in May, being the U.S. Dollar Index. Seven sectors reach the end of their seasonal strength in May, and they are S&P/TSX Composite Index, U.S. Dollar Index (its strength is only a month), Materials, Consumer Staples, Real Estate, Banks, and Gas Utilities.
Importance of Seasonality Trends
Utilizing the market’s historical seasonality trends can provide a useful framework for assessing and then altering the mix of one’s stock portfolio.
Highly volatile markets often open up exceptional opportunities for astute investors to take advantage of market weakness, to buy quality stocks that have declined in price significantly in line with the overall market downdraft.
As a result, market sectors that are “in season” often provide exceptional stock-buying opportunities in such dire market conditions.
Seasonality refers to particular time-frames when stocks/sectors/indexes are subjected to and influenced by recurring tendencies that produce patterns that are apparent in the investment valuation process.
A seasonality study preferably uses at least 10 years of data. Our data is for 14 years.
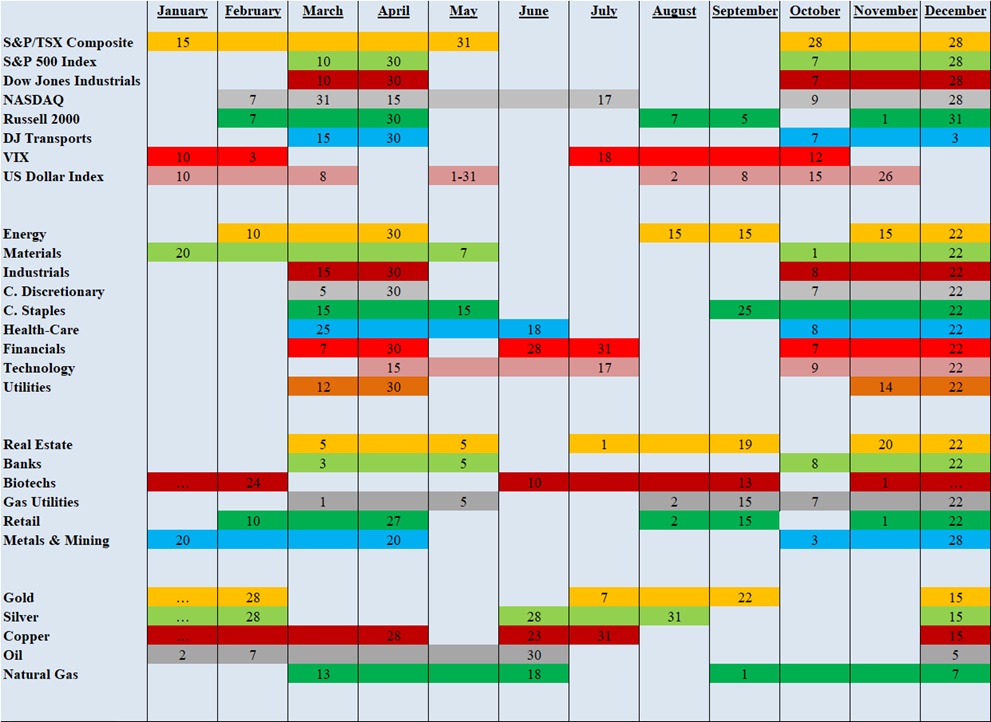
Seasonality Trends Chart
The Seasonality trends chart is an ever-changing 14-year average of the indexes and sub-indexes that we track. The charts are courtesy of www.equityclock.com.
The Seasonality Trends chart below has been updated as of May 2020. It shows the periods of seasonal strength for 28 market segments (sectors/indexes). Each bar indicates a buy and a sell date based upon the optimal holding period for each market sector/index.
//