Analyst Articles

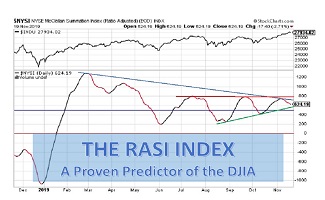
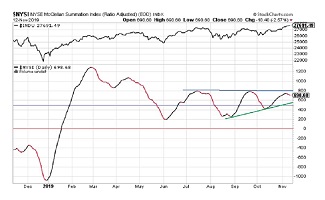
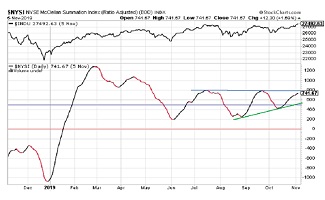
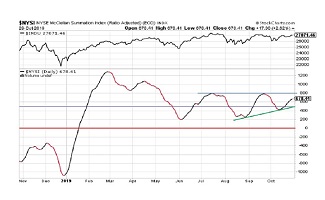
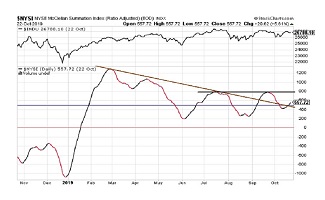
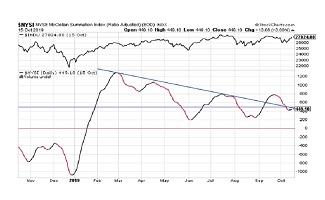
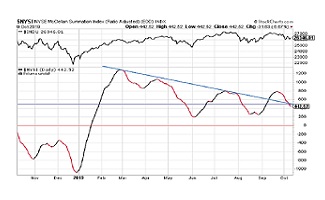
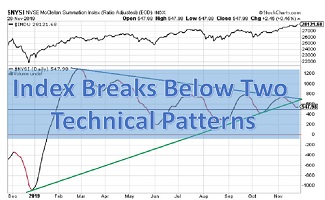
RASI: Index Breaks Below Two Technical Patterns

Last week, the RASI fell out of two triangles that it has been bounded by for months. This is bearish. Since the RASI and the DJIA normally move in sync and since the two indexes have diverged this month, something has to give. [more]

Analyst Articles

RASI: Index Decline Continues; DJIA Trends Higher

The RASI and the DJIA normally move in unison but, since the beginning of November, the two indexes have moved in opposite directions. While the RASI declined, the DJIA moved into new high ground … until Tuesday, November 19. Is the 100-point down-turn in the DJIA the beginning of a pull-back? [more]

Analyst Articles

RASI: Index Declines; DJIA Forges Ahead

The RASI and the DJIA normally move in unison but, over the last five trading days, a slight divergence between the two has occurred. As the RASI moved lower, the DJIA established new all-time highs. This cannot continue for long. [more]

ValueTrend

ValueTrend: Value Versus Momentum

If investors are beginning to rotate away from momentum stocks towards the low P/E and low P/B stocks, then perhaps investors should examine the stock composition of the Value sector ETFs for future investment ideas. [more]

McClellan Chart-In-Focus

U.S. Government Has a Spending Problem

The latest McClellan Chart-In-Focus report from McClellan Financial Publications shows that, provided U.S. federal tax receipts do not exceed 18% of GDP, the stock market tends to move higher. The current rate is 16% so the outlook, using this metric, remains positive. [more]

Analyst Articles

RASI: Index Continues Higher: DJIA Reaches All-Time High

The RASI continues its run higher, rising 9.3% this past week, from 678 to 741. It is now only about 7% below its overhead resistance line at 800. If the Index reaches 800, will this turn out to be a Triple Top or will the Index bullishly break through and continue higher? [more]

Analyst Articles

RASI: Index Continues Higher – DJIA Follows

RASI rose almost 22% this past week, from 557 to 678. It is now within hailing distance (18%) of overhead resistance at 800. Question is: If the Index reaches 800, will this turn out to be a Triple Top or will the Index break through with aplomb and continue its journey higher? [more]

Analyst Articles

RASI: Index Pushes Through Two Key Resistance Levels

With significant bullish undertones, the RASI has climbed back above two critical resistance levels. In this past week, the Index rose above both the extended down-trend line and the benchmark 500 level. If the Index can maintain itself above these levels, then its next test is at 800. [more]

Analyst Articles

RASI: Market Outlook Still Negative; Trend Flattens

The RASI has shown some strength in the last few days. It has stopped its downward trend, at least for now, and is set to try and rally above two critical resistance levels given by the current down-trend line at about 490 and the critical 500 level that measures positive or negative market expectations. [more]