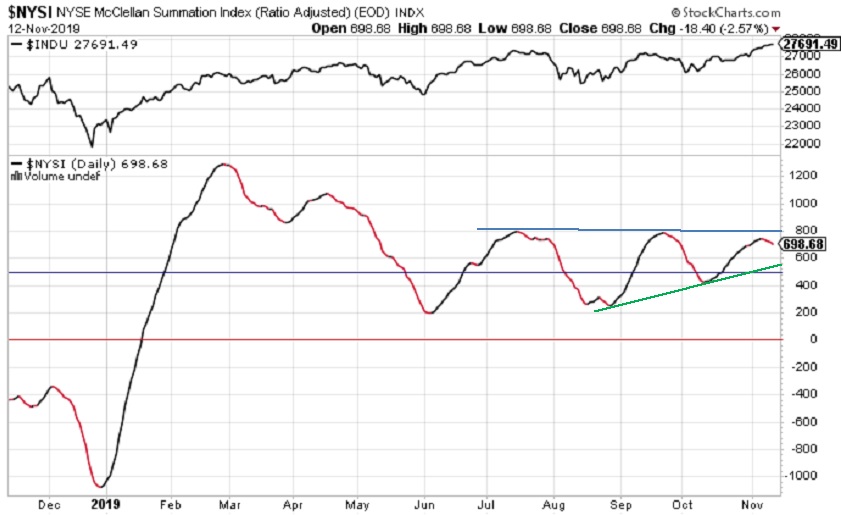
eResearch | The RASI at the close on Tuesday, November 12 is at 698. This is down from 741 a week ago. The Index reached a recent high on Wednesday last week at 743.50 and then declined each successive day. We will have to wait to see if the Index is going to test resistance at 800, as shown by the BLUE line on the accompanying charts.
Ascending Triangle
The Index continues to trend within an ascending triangle, bounded by the lower GREEN up-trend line and the upper BLUE resistance line. This is considered a bullish formation. However, the Index could oscillate within the triangle for quite a while before it decides in which direction it is going to break out. Right now, the Index is closer to the top of the triangle but the support line is rising quickly.
Double Top/Triple Top?
This overhead BLUE resistance line at 800 is 12.8% above the RASI’s current level. That 800 level also represents a Double Top that was recorded in mid-July and mid-September. If the Index rises to the 800 resistance level and fails to penetrate it and move higher, then this would complete a very bearish Triple Top and the Index would then be expected to move lower, perhaps much lower. If it breaks above resistance, our benchmark is that it has to remain at least 3% above the break-out point to be valid. That would be very bullish.
Significance of RASI Index for the Market
The significance of the RASI Index is that it has proven to be a good predictor of the future direction of the DJIA. The upper section of the chart depicts the closing prices of the DJIA and, clearly, there is a good correlation between the two indexes. Since the lows of mid to late August, the RASI and the DJIA both moved higher in unison and, since mid-September, they both moved lower together. In this last five trading days, however, a slight divergence has occurred between the RASI and the DJIA. As the RASI moved lower, the DJIA established new all-time highs. Soon, something has to give.
//
What is the Ratio-Adjusted Summation Index (RASI)?
- The Ratio-Adjusted Summation Index, RASI, is a market indicator developed by Tom McClellan of McClellan Financial Publications.
- A RASI reading that rises to and reaches a specified level (500 and above) can be a signal that a new market up-trend is starting.
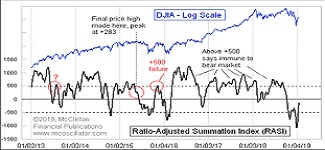
- The +500 level is an important dividing line for the RASI, in terms of giving a go/no-go signal about the new up-trend.
- When a rebound in the RASI occurs, but it falls short of getting up to the 500 level, historically that has meant trouble lies ahead.
- But zooming well above 500 is a sign that there is a lot of strength behind the move, and the higher it goes above 500, the more emphatic the message of strength.
- Conversely, a move from well above 500 down to and below 500 is a signal that the market is weakening and that it should move lower.