On Monday, the DJIA was down 30% year-to-date, even after the U.S. Federal Reserve dropped the benchmark interest rate to zero and launched a new round of quantitative easing by buying US$500 billion worth of Treasuries and US$200 billion worth of Mortgage-Backed securities.
On March 12, before the recent market declines, Tomi Kilgore provided an article on MarketWatch that highlighted some downside mile markers for the DJIA derived from Technical Analysis.
Mr. Kilgore uses major trend lines and Fibonacci retracements. In Technical Analysis, Fibonacci retracement levels use horizontal lines that represent possible support and resistance levels based on “percentages” – the Fibonacci retracement levels are 23.6%, 38.2%, 61.8% and 78.6%.
The DJIA markers used for this analysis include:
- December 24, 2018: Christmas Eve bottom of 21,792
- March 9, 2009: Previous bear market’s bottom of 6,547
- February 11, 2016: Closing low of 15,660
- February 12, 2020: Closing high of 29,551
Chart 1: Downside Fibonacci Retracements
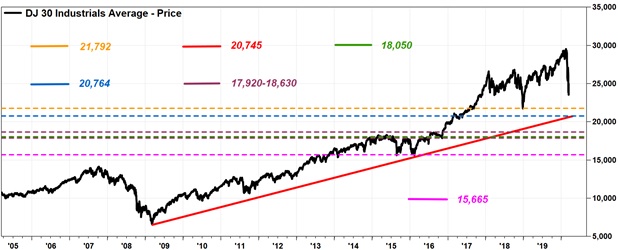
Using the 38.2% retracement level, from the March 2009 closing low to the February 12, 2020 closing high of 29,551, results in the DJIA at about 20,764.
From the same period, the 50% retracement level results in the DJIA around 18,050, which is also supported by a series of new highs set during the period of May 2015 through August 2016.
From the same period, the 61.8% retracement level results in the DJIA around 15,335, which is just below the August 2015-February 2016 double bottom support level around 15,665.
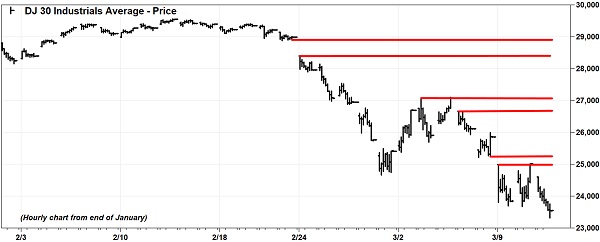
On the upside, gaps that occured in the sudden downward DJIA drops could be viewed as levels to watch: 25,020 to 25,250; 26.670 to 27,090; and 28,400 to 28,990.
Chart 2: Upside DJIA Gaps
To read the full article, click here: https://www.marketwatch.com/story/here-are-some-of-the-dows-key-downside-chart-points-to-watch-2020-03-11
//