eResearch | The RASI at the close on Tuesday, November 26 is at 548. This is down from 624 a week ago and 698 two weeks ago. The Index is now within “ear-shot” of the benchmark 500 level that demarks the transition from a “Positive” market outlook to a “Negative” one. Further, the Index has now dropped below and out of two “triangle” technical patterns, as illustrated in the charts provided below. This is decidedly bearish.
Year-Long Ascending Triangle (with Down-Trend)
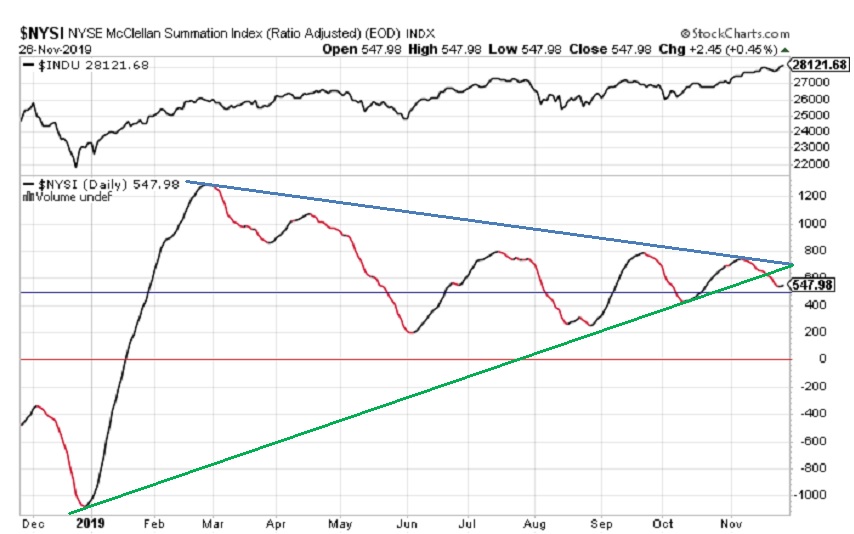
On the chart below, we have drawn a BLUE down-trend line that started around 1300 in late February. The GREEN up-trend line started at the end of December 2018, and now exactly converges with the down-trend line to intercept at about 700 and, thus, complete the triangle. However, as clearly shown, the Index has dropped out of the triangle and is attempting to halt its descent with a modest one-day up-tick. The Index must now stay above the 500 benchmark in order to stay in Positive territory.
$NYSI – NYSE McClellan Summation Index (Ratio Adjusted) – Year-Long Ascending Triangle (with Down-Trend)
Ascending Triangle (with Horizontal Resistance)
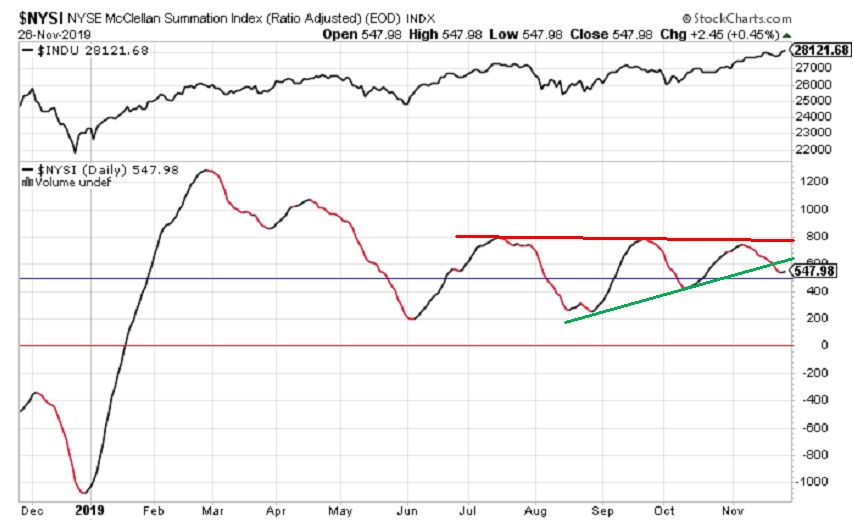
The next chart shows a triangle with a RED resistance line that intercepts at 800, and a GREEN up-trend line that began in late August. The Index has similarly dropped below and out of this triangle.
$NYSI – NYSE McClellan Summation Index (Ratio Adjusted) – Ascending Triangle (with Horizontal Resistance)
Conclusion
With the Index having bearishly dropped out of and below both triangles, its next test to the downside is the 500 benchmark, which is the line-in-the-sand that differentiates a Positive from Negative reading that is associated with future stock market direction.
Significance of RASI Index for the Market
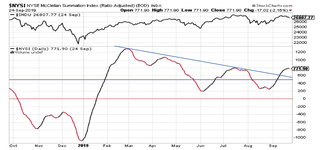
The RASI Index has proven to be a good predictor of the future direction of the DJIA. The upper section of the chart above depicts the closing prices of the DJIA and, clearly, there is a good correlation between the two indexes. Since the lows of mid to late August, the RASI and the DJIA both moved higher in unison and, from mid-September until almost mid-October, they both moved lower together. At that point, they both moved higher together until the beginning of November. Then, the two indexes diverged. The RASI has moved considerably lower, while the DJIA has continued higher.
While short-term aberrations between the two Indexes can occur from time to time, a prolonged divergence ultimately ends with the Indexes moving back in sync together. Since this divergence has been trending since the beginning of November, either the RASI will have to turn back up to match the DJIA’s upward trend this month, or the DJIA is about to fall to catch up to the RASI’s month-long decline. Stay tuned.
#####
What is the Ratio-Adjusted Summation Index (RASI)?
- The Ratio-Adjusted Summation Index, RASI, is a market indicator developed by Tom McClellan of McClellan Financial Publications.
- A RASI reading that rises to and reaches a specified level (500 and above) can be a signal that a new market up-trend is starting.
- The +500 level is an important dividing line for the RASI, in terms of giving a go/no-go signal about the new up-trend.
- When a rebound in the RASI occurs, but it falls short of getting up to the 500 level, historically that has meant trouble lies ahead.
- But zooming well above 500 is a sign that there is a lot of strength behind the move, and the higher it goes above 500, the more emphatic the message of strength.
- Conversely, a move from well above 500 down to and below 500 is a signal that the market is weakening and that it should move lower.
///