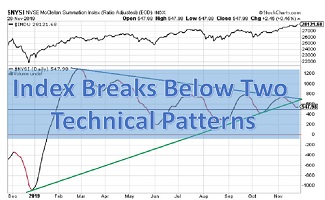
eResearch | The RASI at the close on Wednesday, October 9 is at 442. This is down from 682 in our report last week. As shown on the chart, the Index has decidedly turned down and has gone below not only the critical 500 level that denotes the dividing line between Positive and Negative market expectation, but also below the down-trend line that began last February around 1300.
The fact that the Index is now below both of these key indicators could have serious implications for the market’s future direction.
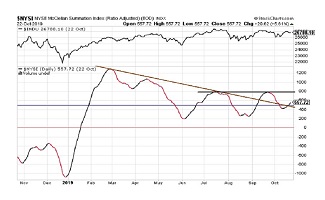
RASI Index as a Predictor of the DJIA
The significance of the RASI Index is that it has proven to be a good predictor of the future direction of the DJIA. The upper section of the chart depicts the closing prices of the DJIA and, clearly, there is a good correlation between the two indexes. Since the lows of mid to late August, the RASI and the DJIA both moved higher in unison and, since mid-September, they are now moving lower in unison.
The next levels of support after these two significant failed tests is provided by the June low and then the August low, which translates into a range of about 200-220. That range is still a long way below the current Index reading. If these downside levels are reached, this could indicate that the DJIA might test its August lows around 25,500 or even its early June lows below 25,000 at about 24,750.

//
What is the Ratio-Adjusted Summation Index (RASI)?
- The Ratio-Adjusted Summation Index, RASI, is a market indicator developed by Tom McClellan of McClellan Financial Publications.
- A RASI reading that rises to and reaches a specified level (500 and above) can be a signal that a new market up-trend is starting.
- The +500 level is an important dividing line for the RASI, in terms of giving a go/no-go signal about the new up-trend.
- When a rebound in the RASI occurs, but it falls short of getting up to the 500 level, historically that has meant trouble lies ahead.
- But zooming well above 500 is a sign that there is a lot of strength behind the move, and the higher it goes above 500, the more emphatic the message of strength.
- Conversely, a move from well above 500 down to and below 500 is a signal that the market is weakening and that it should move lower.