eResearch | Historically, although not as strong as the October to December period, January has proved to be a fairly good month for stocks as investor optimism at the start of a new year often impacts market sentiment.
In December, many indexes/sectors reached the end of their seasonality strength. This situation makes those indexes and sectors that remain in seasonal focus even more important and would be areas where astute investors should look for opportunities. See the chart below.
Changes for January
There are 4 additions in January to the seasonality mix while, over the ensuing four weeks, there is only one sector, Oil & Gas Exploration, which reaches the end of its seasonality strength. Oddly, this sector comes back into focus in February until May so some investors may wish to just ride it out. With the Energy sector being out of investor favour for so long, unexpected strength could happen at any time and it would be a pity to miss it if it should occur.
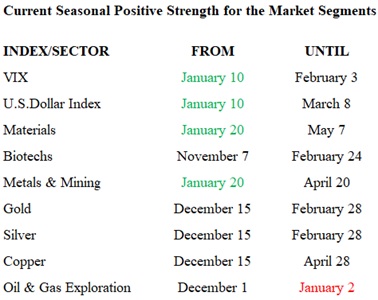
Seasonal Trends for the Market Segments in January
The following table shows which indexes and sectors are “in season” during the month of January. There are four additions this month, shown in GREEN under FROM, and one expiry this month, shown in RED under UNTIL.
NOTE: A full seasonality list of indexes and sectors is provided at the end of this report.
The market sectors added to the seasonality mix in January are the VIX, the U.S. Dollar Index, Materials, and Metals & Mining.
Importance of Seasonality Trends
Seasonality refers to particular time-frames when stocks/sectors/indexes are subjected to and influenced by recurring tendencies that produce patterns that are apparent in the investment valuation process. A seasonality study preferably uses at least 10 years of data.
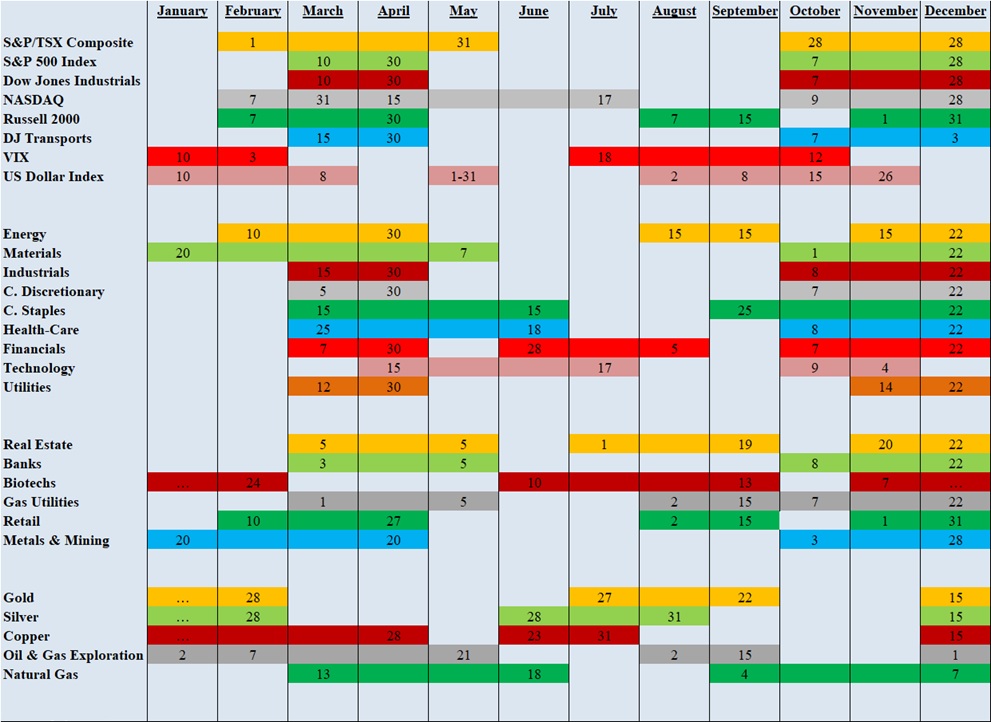
Seasonality Trends Chart
The Seasonality Trends chart below was updated in December 2020. The chart shows the periods of seasonal strength for 28 market segments (sectors/indexes). Each bar indicates a buy and a sell date based upon the optimal holding period for each market sector/index.
The Seasonality trends chart is an ever-changing 14-year average of the indexes and sub-indexes that we track. The information in the chart is courtesy of www.equityclock.com.