eResearch | As an adjunct to these Seasonality Trends reports, we have started publishing regular ETF reports, which involves comparing and contrasting Canadian and U.S. market sectors through their respective ETFs. In all, we track 12 Canadian sector ETFs and 12 U.S. sector ETFs. On March 5th, we published our comparison of the Energy ETFs. Up next is an appraisal of the respective Financials ETFs.
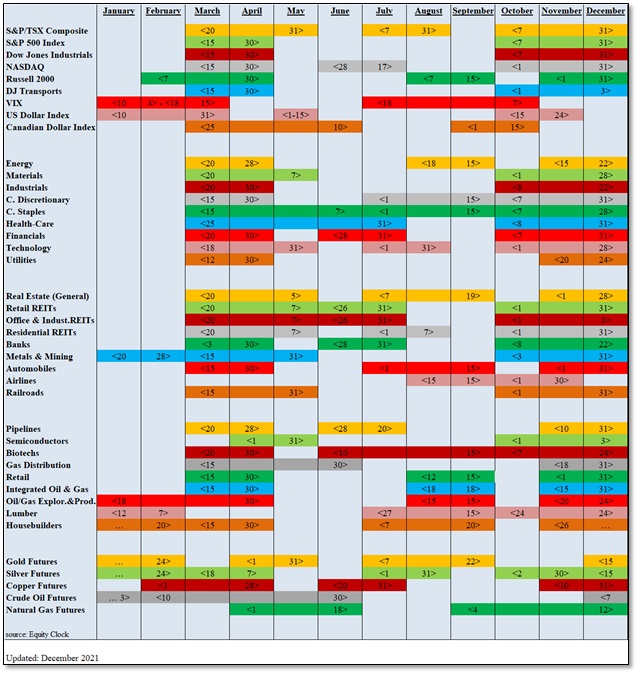
Analyzing the Chart (Figure 2 below) of all of the market sectors that we append to each of these Seasonality Trends reports allows us to gauge just what market sectors follow their usual periods of market strength. This permits an opportunity to invest either in the sector ETF directly or in any of the prominent companies that comprise that particular market sector.
COMMENT: We recommend that Readers of our Seasonality Trends reports also read our ETF reports. We provide information on the performance of the ETFs because Investors can use this information in conjunction with the seasonality trends of the corresponding market sectors provided in these Seasonality Trend reports. For instance, Energy leaves its seasonal period of market strength at the end of April. After such a strong performance since the beginning of the year, is it now time to exit this sector and the key companies that make up the sector index? Conversely, Technology, which has performed abysmally since the beginning of the year, just entered one of its periods of strength: March 18 – May 31. The ETF has already responded since this period of strength began. But, is there additional upside over the remainder of this brief period of market strength? We think so.
Although not ETF sectors, the major market indexes also can be used for comparison purposes. Interestingly, to date, there are key differences between the performances of the Canadian and U.S. market indexes. For the first three months of the year, three major Canadian indexes are all in positive territory as compared to the corresponding three U.S. indexes that are producing negative returns. All of this information is presented in our Financials ETF report.
Changes for April
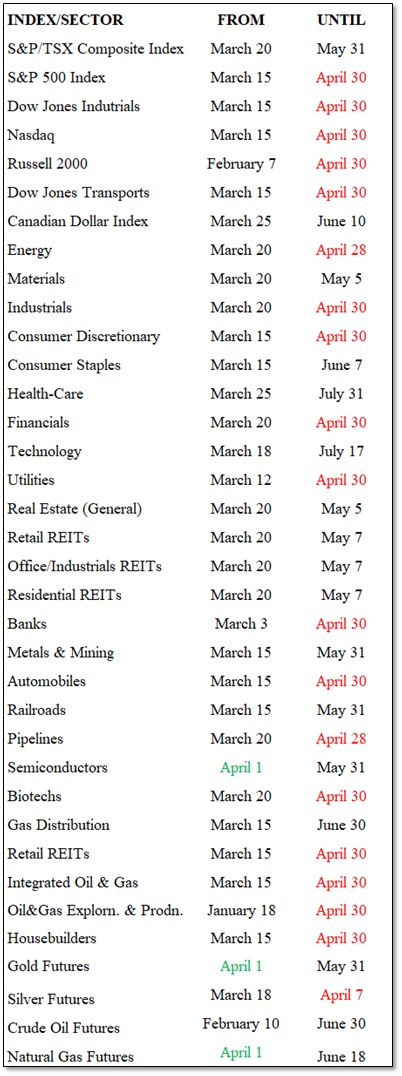
There are THREE market indexes/sectors that exhibit new seasonal strength in April, which are Semiconductors, Gold Futures, and Natural Gas Futures. These are shown in Figure 2 below.
The NINETEEN indexes that leave their period of seasonality strength are also indicated in Figure 1 below.
There were TWO indexes/sectors that left during the month of March. They were the VIX and the U.S. Dollar Index. (Interestingly, the Canadian Dollar Index entered an almost three-month period of strength (March 25 – May 10).
Seasonal Trends for the Market Segments in April
The following table shows which indexes/sectors gain or lose seasonal strength during the month of April. There are 3 additions this month, shown in GREEN under FROM, and there are 19 expiries this month, shown in RED under UNTIL.
NOTE: A full seasonality list of indexes and sectors is provided at the end of this report.
Figure 1: Current Seasonal Positive Strength for the Market Segments
Importance of Seasonality Trends
Seasonality refers to particular time-frames when stocks/sectors/indexes are subjected to and influenced by recurring tendencies that produce patterns that are apparent in the investment valuation process. A seasonality study preferably uses at least 10 years of data.
Seasonality Trends Chart
The Seasonality Trends chart below was updated in December 2021. The chart shows the periods of seasonal strength for 41 market segments (sectors/indexes). Each bar indicates a buy and a sell date (start/end dates) based upon the optimal holding period for each market sector/index.
The Seasonality Trends chart is an ever-changing 14-year average of the indexes and sub-indexes that we track. The information in the chart is courtesy of www.equityclock.com.
Figure 2: Seasonality Trends Chart
Notes: All numbers in CAD unless otherwise stated. The author of this report, and employees, consultants, and family of eResearch may own stock positions in companies mentioned in this article and may have been paid by a company mentioned in the article or research report. eResearch offers no representations or warranties that any of the information contained in this article is accurate or complete. Articles on eresearch.com are provided for general informational purposes only and do not constitute financial, investment, tax, legal, or accounting advice nor does it constitute an offer or solicitation to buy or sell any securities referred to. Individual circumstances and current events are critical to sound investment planning; anyone wishing to act on this information should consult with a financial advisor. The article may contain “forward-looking statements” within the meaning of applicable securities legislation. Forward-looking statements are based on the opinions and assumptions of the Company’s management as of the date made. They are inherently susceptible to uncertainty and other factors that could cause actual events/results to differ materially from these forward-looking statements. Additional risks and uncertainties, including those that the Company does not know about now or that it currently deems immaterial, may also adversely affect the Company’s business or any investment therein. Any projections given are principally intended for use as objectives and are not intended, and should not be taken, as assurances that the projected results will be obtained by the Company. The assumptions used may not prove to be accurate and a potential decline in the Company’s financial condition or results of operations may negatively impact the value of its securities. Please read eResearch’s full disclaimer.