eResearch | We track 12 Canadian sector ETFs and 12 U.S. sector ETFs. What we present in these ETF reports is a comparison of the performance of selected Canadian and U.S. ETF sectors. In our first ETF report, we highlighted the Energy Sector. In this report, we look at the Financial Sector ETFs.
Canadian & U.S. Sector Comparison
Figure 1 below shows the performance of all of the market sectors, as exemplified by the respective ETFs, at the end of each of the first three months of 2022.
Figure 1: Canadian and U.S. Sector ETF Comparison
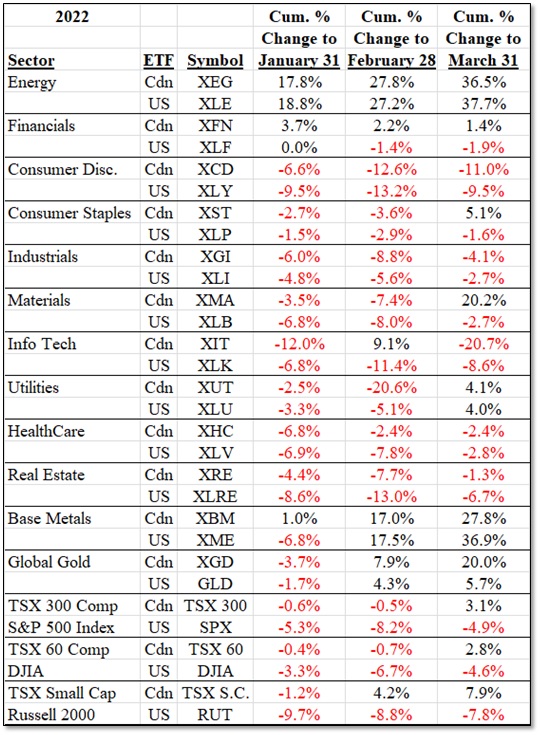
Observation: Figure 1 above shows the large variation in the performance of market sector ETFs in Canada and the USA, both in terms of comparing the Canadian sector ETF with its U.S. “cousin”, and also between the various ETF sectors themselves. Consistently for the first three months of 2022, Energy has been the star performer. Base Metals have also elevated itself into the top mix. This is consistent with the strong performance of commodities in recent months, as well documented in the media. Global Gold has picked up its performance levels, especially in Canada, and essentially on the back of the Russia-Ukraine war. Real Estate is a notable laggard in the USA; much less so in Canada. Consumer Discretionary has performed poorly in both countries. Materials has done well in Canada but has negative returns in the USA. Another interesting performance difference pertains to the market indexes. The S&P/TSX 300 Composite Index has done much better than the S&P 500 Index. Likewise, the TSX 60 Composite Index has completely outshone the Dow Jones Industrial Average. The TSX Small Cap Index is well positive whereas the Russell 2000 is well in negative territory in the year to date.
Top ETFs for March and January-March
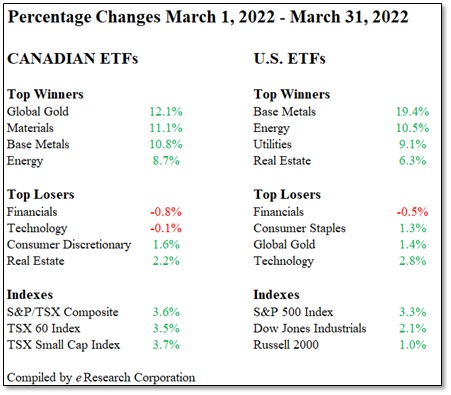
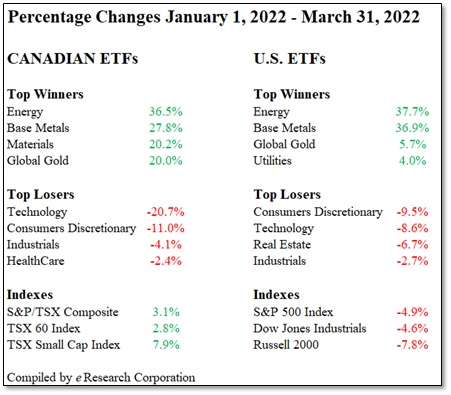
Figure 2 shows the top four ETF winners and losers on the Canadian and the U.S. exchanges for the month of March and also for the first three months of the year.
Figure 2: Top Four ETF Winners and Losers
1. For March 2022
2. For January 1 – March 31, 2022
Sector Analysis: Focus On Financials
The Financial Sector is a major component of the composition of the equity portion of stocks on the Toronto Stock Exchange. It also has significant representation in the U.S. equity markets as well.
In 2022, so far, this sector has not performed well, relatively, in both countries even though the respective performance has been better than many other sectors. The left side of Figure 3 below shows the respective bi-monthly prices of the Canadian (TSX:XFN) and U.S. (NYSE:XLF) Financial ETFs, while the right side displays the cumulative percentage change in each ETF. The Canadian Financial ETF (+1.4%) has outperformed its U.S. counterpart (-1.9%).
Figure 3: XFN Versus XLF in 2022 To March 31
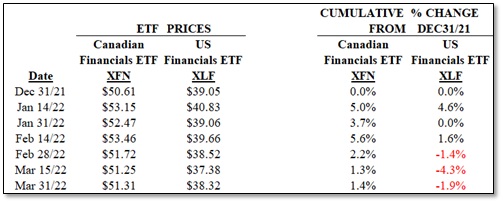
Figure 4 below shows the performance of some representative Canadian and U.S. financial companies.
Figure 4: Representative Canadian and U.S. Financial Companies Stock Performance 2022 To Date
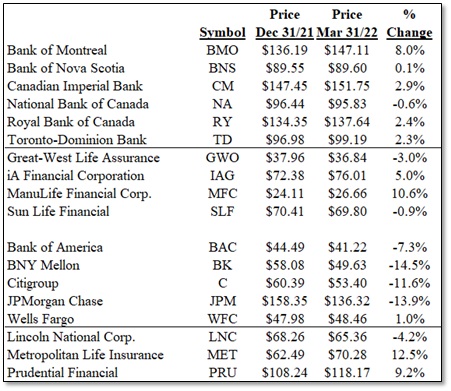
The above is only a representative list and does not include other companies that are contained in the composition of each country’s Financial Sector ETF.
For comparison purposes, we take a look at what transpired in 2021 for these ETFs.
Figure 5 below shows the end-of-month prices for both ETFs (left columns) and also the monthly percentage changes (right columns). We show the information in both tabular and chart forms.
Figure 5: Table of XFN and XLF 2021 End-of-Month Prices and Monthly Percentage Changes
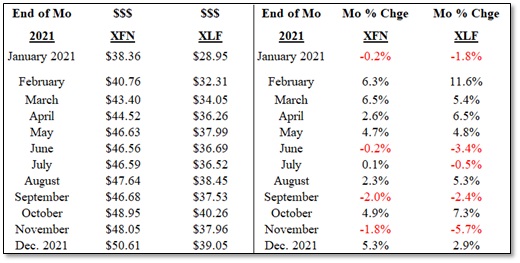
Figure 6: Chart of XFN and XLF 2021 End-of-Month Prices and Monthly Percentage Changes
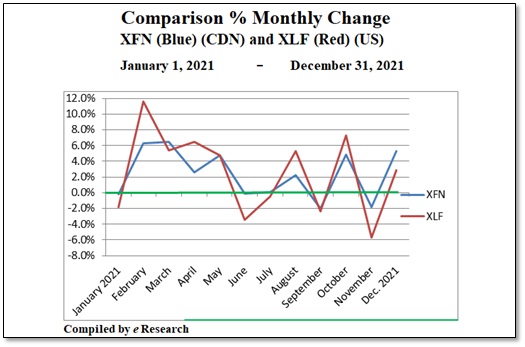
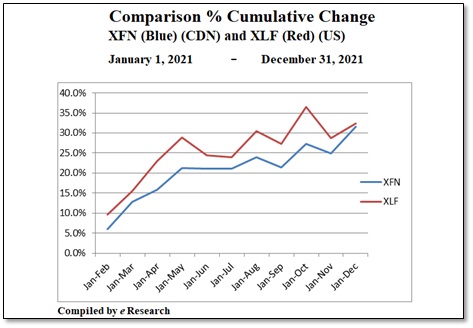
Next, we have the cumulative monthly changes in these two ETFs. Despite the gyrations shown in Figure 6 above, at the end of the year, both ETFs reported almost the same cumulative change for 2021, with a slight advantage over the U.S. ETF. In addition, as the Figure 8 chart below clearly shows, the U.S. ETF outperformed its Canadian counterpart for the entire year.
Figure 7: Table of XFN and XLF 2021 Cumulative Monthly Changes
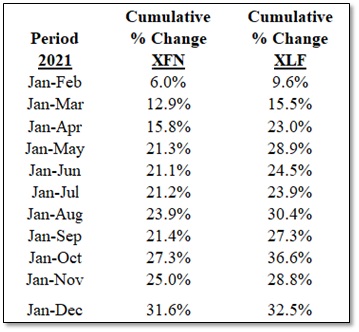
Figure 8: Chart of XFN and XLF 2021 Cumulative Monthly Changes
Conclusion
In a rising interest rate environment, which we are now in, and we are in its early days, banking institutions and insurance companies tend to do well.
Banks can improve their margins on spreads. As interest rates rise, loan profitability increases because there is a greater spread between the federal funds rate and the rate that the banks charge their customers. The spread between long-term and short-term rates also increases during a period of rising interest rates because long-term rates increase faster than short-term rates.
Insurance companies also benefit as their cash flows can be invested at higher yields, which lessens their reinvestment risk.
As such, given the tepid performance of the Financial Sector so far in 2022, there could be opportunities for gain over the balance of the year. Investments could be made either in the ETFs or the companies directly.
Market Outlook
Irrespective of a possible positive performance for the Financial Sector in the latter half of 2022, our opinion on the outlook for the overall stock market for the rest of 2022 is less sanguine. After an exceptional performance in 2021 by all of the major stock indexes, it is incumbent to be somewhat cautious and not to expect too great a performance in 2022. Last year, the market benefited from the economic recovery associated with the ending of COVID-19 restrictions in many areas, and the very positive comparisons with a decimated 2020. This year, the economic recovery is likely to stall as interest rates rise and higher inflation rates become increasingly depressant.
The war between Ukraine and Russia is also a key determinant in deciding the direction of where the market could trend in the months ahead. We believe that the market will perform strongly for a brief time as soon as a peace agreement is reached, whenever that might be. After that, at least at this point, we believe that the market is likely to drift sideways or even retrench somewhat as it returns to consolidating last year’s gains. In that respect, sector rotation and seasonal strength become increasingly important aspects to guide investment decisions.
Notes: All numbers in CAD unless otherwise stated. The author of this report, and employees, consultants, and family of eResearch may own stock positions in companies mentioned in this article and/or may have been paid by a company mentioned in the article or research report. eResearch offers no representations or warranties that any of the information contained in this article is accurate or complete. Articles on eresearch.com are provided for general informational purposes only and do not constitute financial, investment, tax, legal, or accounting advice nor does it constitute an offer or solicitation to buy or sell any securities referred to. Individual circumstances and current events are critical to sound investment planning; anyone wishing to act on this information should consult with a financial advisor. The article may contain “forward-looking statements” within the meaning of applicable securities legislation. Forward-looking statements are based on the opinions and assumptions of the Company’s management as of the date made. They are inherently susceptible to uncertainty and other factors that could cause actual events/results to differ materially from these forward-looking statements. Additional risks and uncertainties, including those that the Company does not know about now or that it currently deems immaterial, may also adversely affect the Company’s business or any investment therein. Any projections given are principally intended for use as objectives and are not intended, and should not be taken, as assurances that the projected results will be obtained by the Company. The assumptions used may not prove to be accurate and a potential decline in the Company’s financial condition or results of operations may negatively impact the value of its securities. Please read eResearch’s full disclaimer.