eResearch | The seasonality strength of thirteen indexes/sectors expire in April, with many occurring at the end of the month. This certainly gives credence to the time-worn stock market adage: sell in May and go away. If you accept this theory, then it might be prudent to sell all or part of profitable positions over this coming month. This advice is supported by the fact that April traditionally is a good month for investors, and it is always good to book a profit when you can.
As April dawns, many of the key indexes are near or at all-time highs.
CHART 1: Indices Update
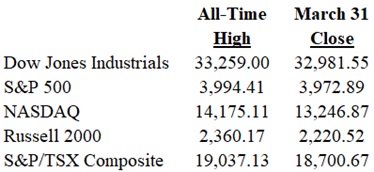
Over the last three months, only the NASDAQ has not churned consistently higher.
The market is always forward-looking and, in the current circumstances, the market is anticipating success with the global vaccine program and a return of consumers with their pent-up savings to galvanize the general economy. This is giving impetus to stocks but also sets up a selling scenario for stocks if the expectations do not match reality.
Changes for April
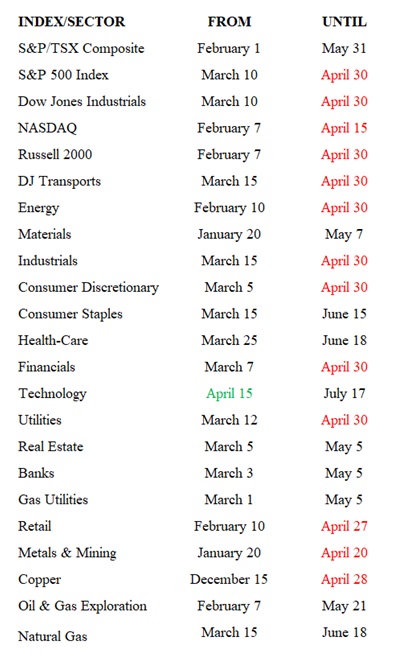
There is just one addition, Technology, to seasonality strength in April, but there are thirteen indexes/sectors that see their seasonality strength come to an end this month.
Seasonal Trends for the Market Segments in April
The following table shows which indexes and sectors come into seasonal strength during the month of March. There is 1 addition this month, shown in GREEN under FROM, and 13 expiries this month, shown in RED under UNTIL
NOTE: A full seasonality list of indexes and sectors is provided at the end of this report.
CHART 2: Current Seasonal Changes for the Market Segments
Importance of Seasonality Trends
Seasonality refers to particular time-frames when stocks/sectors/indexes are subjected to and influenced by recurring tendencies that produce patterns that are apparent in the investment valuation process. A seasonality study preferably uses at least 10 years of data.
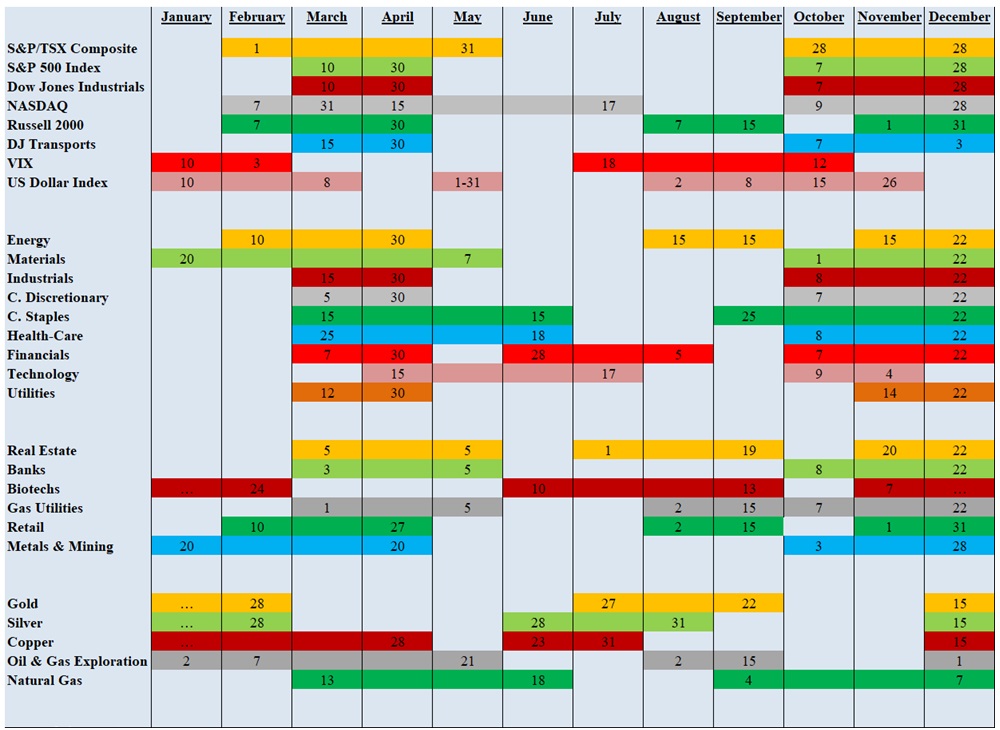
Seasonality Trends Chart
The Seasonality Trends chart below was updated in December 2020. The chart shows the periods of seasonal strength for 28 market segments (sectors/indexes). Each bar indicates a buy and a sell date based upon the optimal holding period for each market sector/index.
The Seasonality trends chart is an ever-changing 14-year average of the indexes and sub-indexes that we track. The information in the chart is courtesy of www.equityclock.com.
CHART 3: Seasonality Trends Chart
Notes: All numbers in CAD unless otherwise stated. The author of this report, and employees, consultants, and family of eResearch may own stock positions in companies mentioned in this article. eResearch offers no representations or warranties that any of the information contained in this article is accurate or complete. Articles on eresearch.com are provided for general informational purposes only and do not constitute financial, investment, tax, legal or accounting advice nor does it constitute an offer or solicitation to buy or sell any securities referred to. Individual circumstances and current events are critical to sound investment planning; anyone wishing to act on this information should consult with a financial advisor. The article may contain “forward-looking statements” within the meaning of applicable securities legislation. Forward-looking statements are based on the opinions and assumptions of management of the Company as of the date made. They are inherently susceptible to uncertainty and other factors that could cause actual events/results to differ materially from these forward-looking statements. Additional risks and uncertainties, including those that the Company does not know about now or that it currently deems immaterial, may also adversely affect the Company’s business or any investment therein. Any projections given are principally intended for use as objectives and are not intended, and should not be taken, as assurances that the projected results will be obtained by the Company. The assumptions used may not prove to be accurate and a potential decline in the Company’s financial condition or results of operations may negatively impact the value of its securities. Please read eReserach’s full disclaimer.