eResearch | Today we focus on the S&P/TSX Composite Index, Canada’s senior stock index of 239 companies. Yesterday, September 12, saw the Index reach a new all-time intra-day high of 16,696.40. However, at the end of the day, the Index closed at 16,643.28, which is just slightly lower than its all-time closing high recorded on April 23, 2019 of 16,669.40.
Compared to its U.S. counter-part, the S&P 500 Index, the Canadian Index has badly under-performed. This is explained by realizing that the Canadian market is nowhere near as diversified as its American cousin. Canada’s senior Index is heavily weighted to Financials and Commodities (Energy, Mining and Materials). Together these two components comprise approximately 70% of the Index’s value. Energy and Mining’s poor performance for a few years now has badly curtailed the overall Index’s gains.
Energy’s outlook has improved somewhat, although perhaps that is not surprising given the severe out-of-favour status that it has endured for some time. The outlook for Mining and Materials is also looking a little better, although much is riding on the USA and China patching up their differences and reaching a trade truce. All of this implies that Canada’s benchmark Index could finally begin to show some life.
Below, we look at some technical aspects surrounding the Index.
Chart 1: S&P/TSX Composite Index – 10 Years
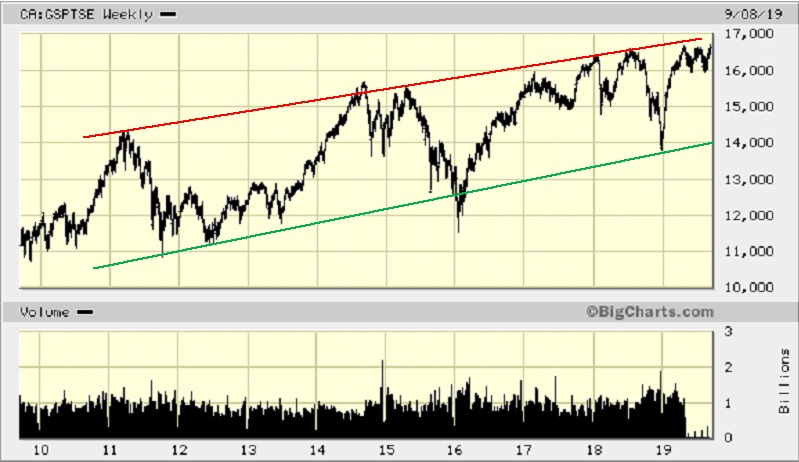
Observation: The chart above shows that the Composite Index has generally traded between two channel lines over the past ten years. It is again challenging the upper resistance Red line. It breached its lower support Green line in early 2016 but quickly rebounded. It also tested the support line in late 2018 but, again, recovered sharply and has performed well in 2019 to date.
The next chart looks at the Composite over the last five years.
Chart 2: S&P/TSX Composite Index – 5 Years
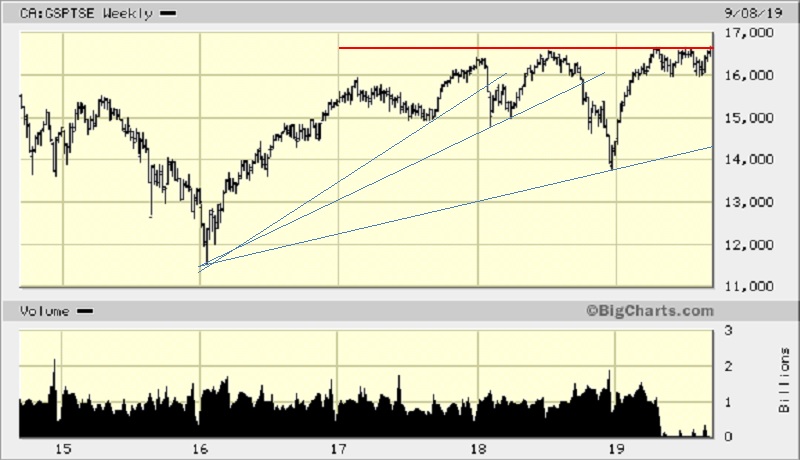
Observation: Since early 2018, the Composite Index has been trying to gain new all-time high ground. Two sharp recovery up-trend Blue lines could not be sustained (no surprise given their slope) but the third retreat in late 2018-early 2019 is well intact. The “Comp” is now pressing against the Red resistance line that it has tried to overcome, and failed, three previous times.
Fourth time lucky? We think so. However, we are less sanguine about how far the rally will go. There is still much political and economic upheaval on a global basis to give overwhelming confidence in sustained positive market performance. eResearch already has initiated its Count-Down to a possible Economic Recession for Canada (see our Recession Barometer reports) and, although it has very recently pulled back from the brink, the U.S. situation remains perilous.
The next chart shows the Composite Index for a one-year period.
Chart 3: S&P/TSX Composite Index – 1 Year
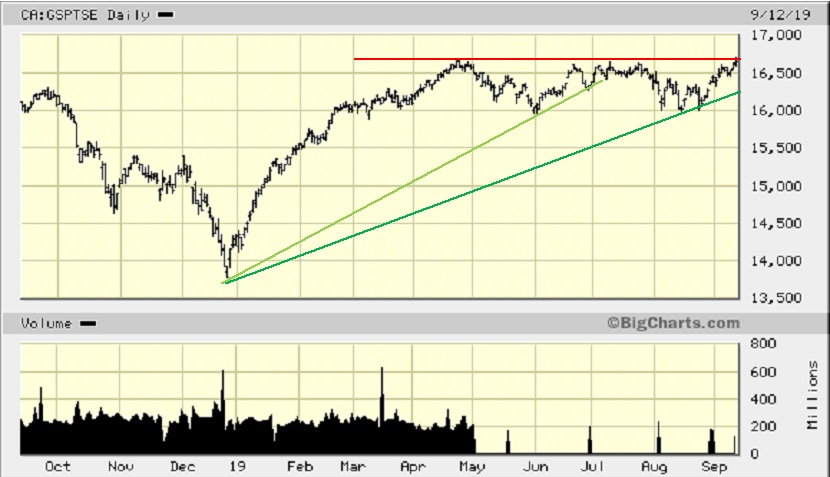
Observation: This chart shows more clearly the Composite Index’s attempt to break above resistance (the Red line). The first up-trend line for 2019, the Light Green line, was broken in July. The triple bottom in August sets the stage for a decision on future direction.
Chart 4: S&P/TSX Composite Index – 6 Months
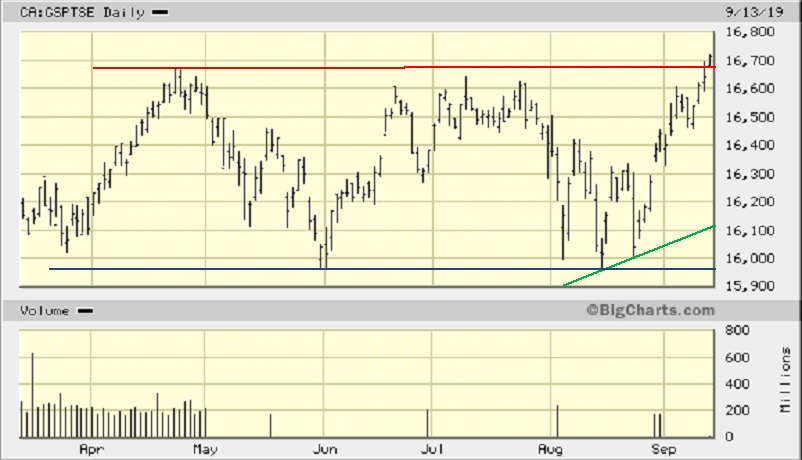
Observation: The six-month chart above shows that the S&P/TSX Composite Index is trying to break through and leave behind the Red resistance line. If it can do this, it will forge into new all-time high territory. The Green line is the same one that was drawn on the one-year chart. The Blue line shows that, since the end of March, the Comp is tracing a rectangle, which is a “holding” pattern. The Index is now attempting to break out of that rectangle.
COMMENT: You will have noticed, I hope, that the volume figures stopped at the end of April. I have no idea why.
//