You can download the Chart-of-the-Day report at the following link: … DayChart_031819_RGMP

Market Pundits
Tech Talk: Market Analysis – February 5, 2019
eResearch is pleased to provide Tech Talk, which is a professional and insightful technical analysis newsletter that comments on interesting chart patterns and pertinent technical action of North American equities. See, also, its sister publication, Equity Clock, also published, with permission, on this website. [more]
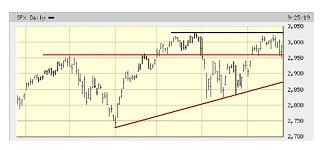
Chart-of-the-Day
S&P 500 Index Marking Time
The S&P 500 Index has recently backed off its all-time high of 3,027 and fallen below the psychologically important 3,000 level. Critical support levels are at 2,950 and 2,875. [more]
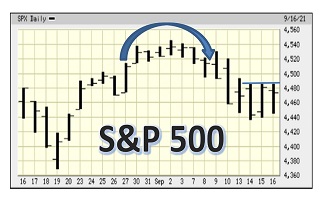
Chart-of-the-Day
Chart of the Day – Has the S&P 500 Peaked?
The S&P 500 Index might have reached a near-term peak. The index is struggling to stay above its rising trend-line. It has also experienced a near-perfect, albeit short, “roll-over”. Is this the start of a pull-back? [more]